Workload Overview Dashboard
Example of Prodstack's PromQL Datasource Powers
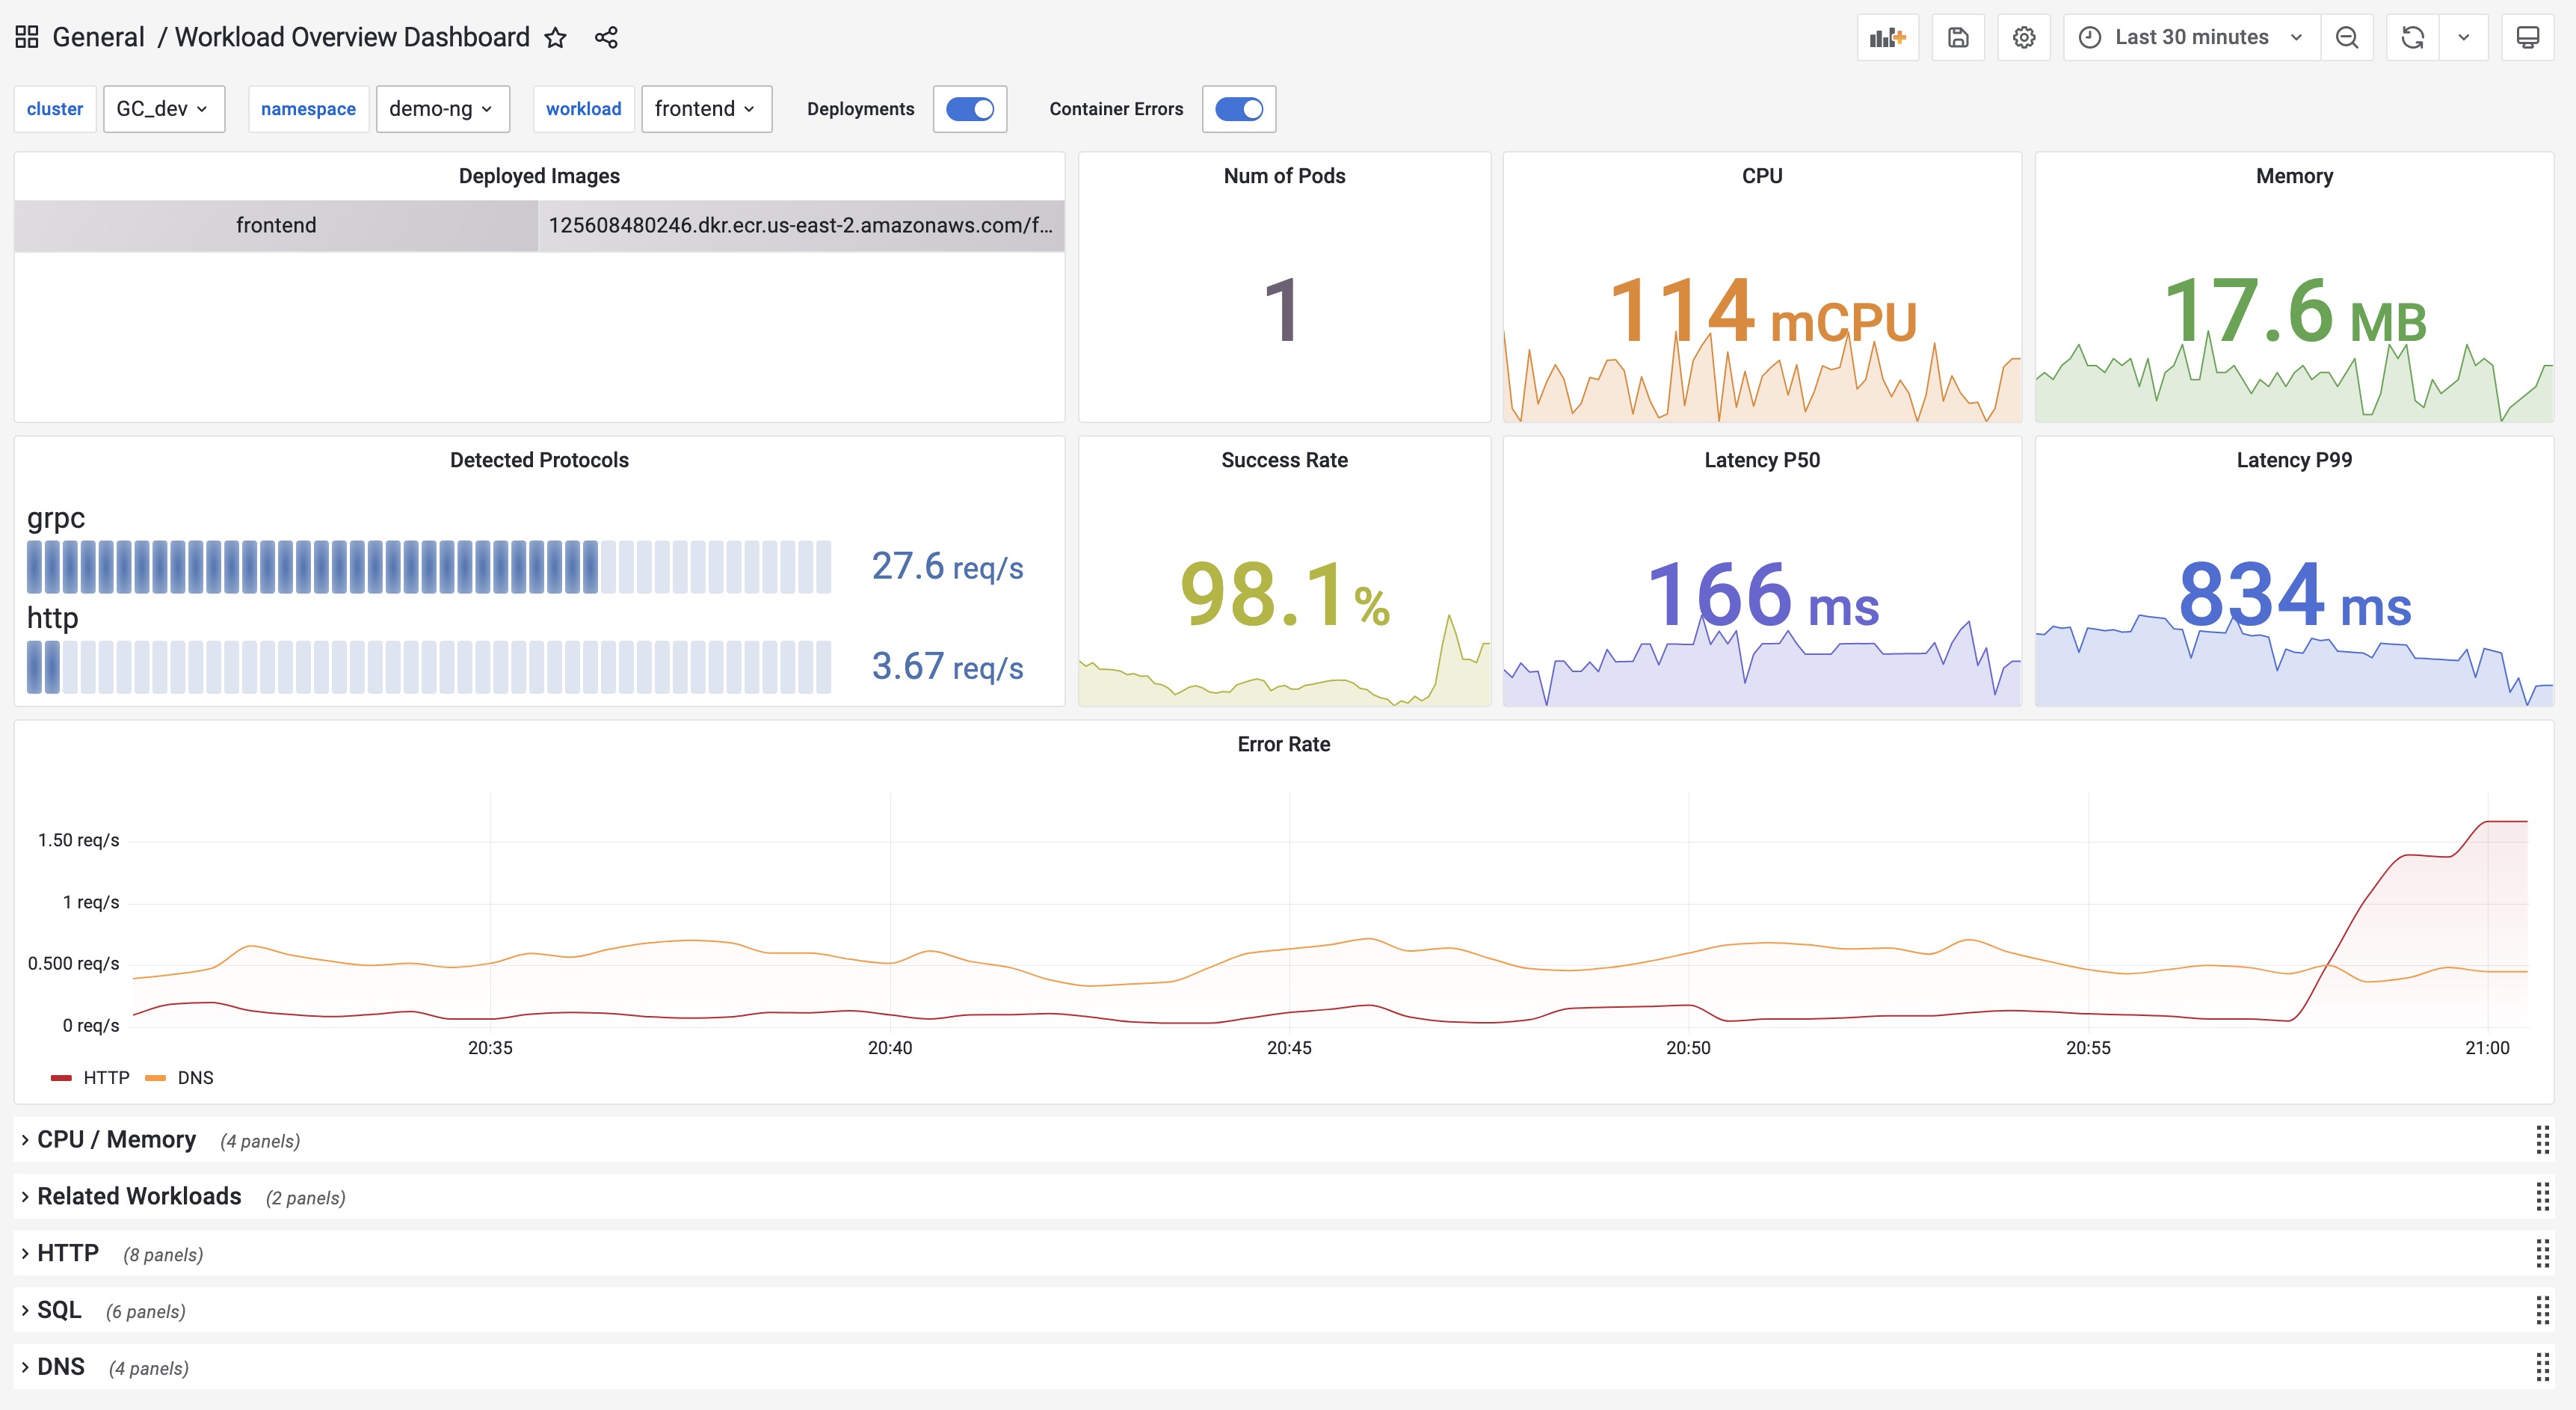
The Workload Overview Dashboard dashboard uses the postgres and prometheus data sources to create a Grafana dashboard with the bargauge, piechart, stat, table and timeseries panels.
Data source config
Collector type:
Collector plugins:
Collector config:
Revisions
Upload an updated version of an exported dashboard.json file from Grafana
| Revision | Description | Created | |
|---|---|---|---|
| Download |