Terraform Enterprise
A Grafana dashboard for Terraform Enterprise
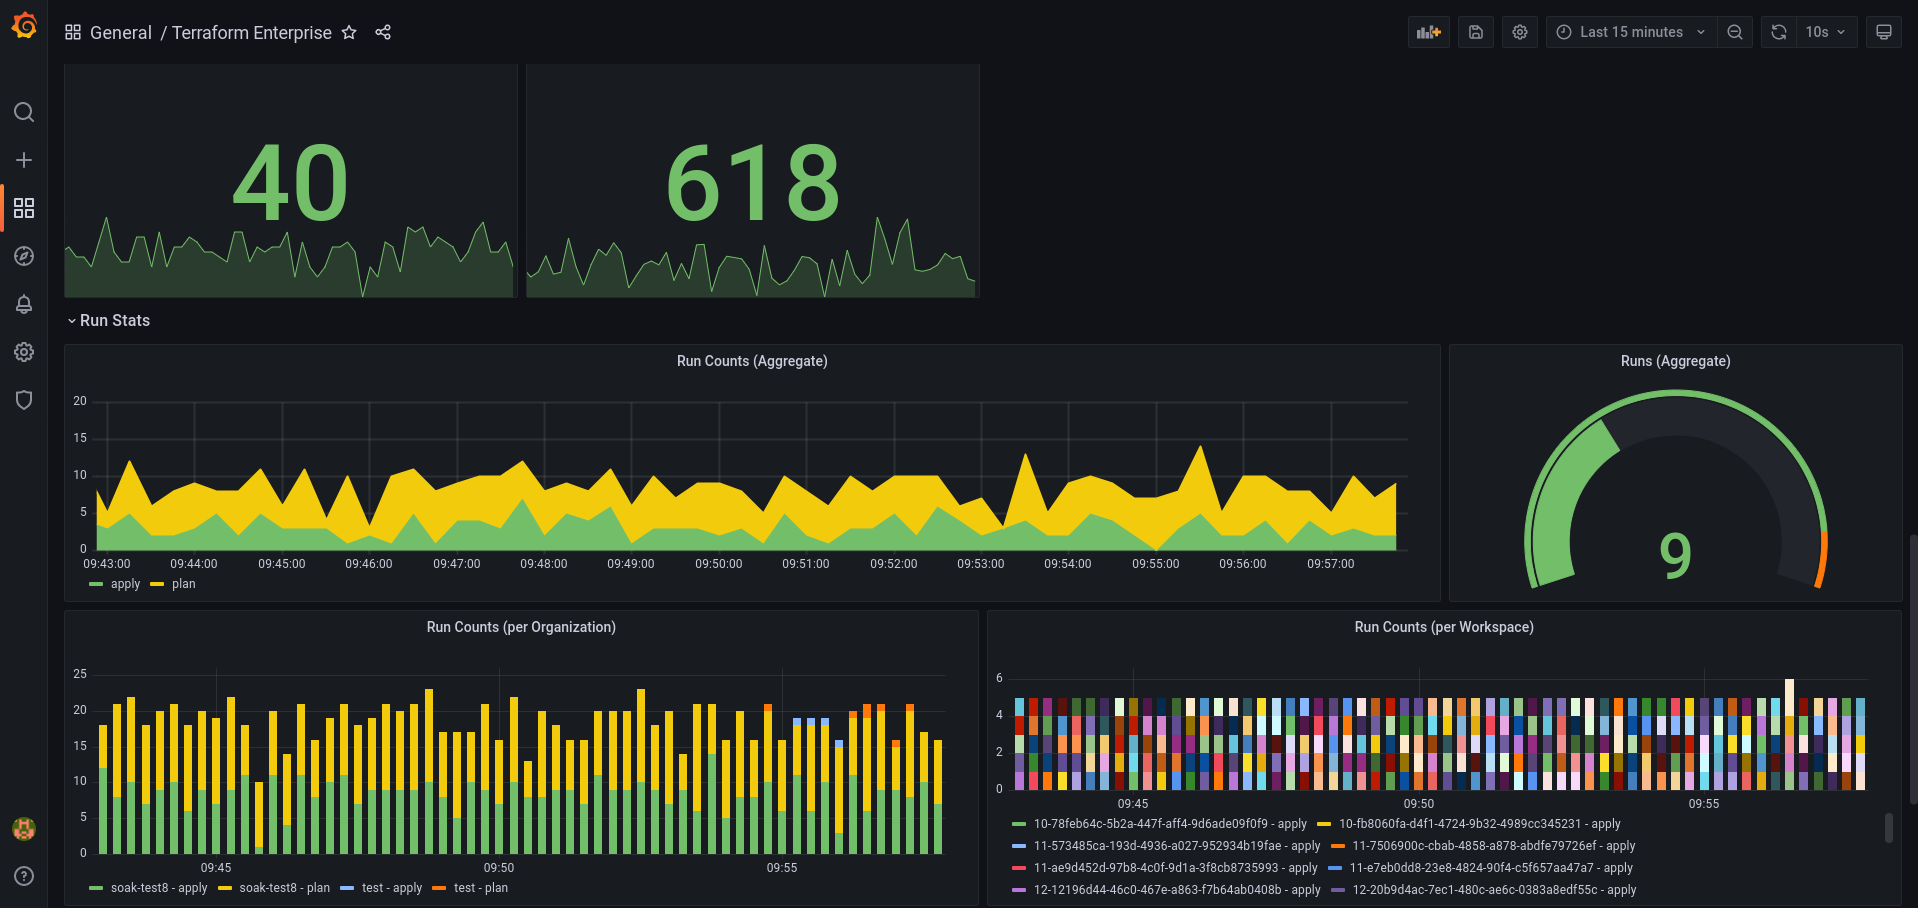
Terraform Enterprise Monitoring Dashboard
Maintained by the Terraform Enterprise team at HashiCorp. Displays container resource utilization metrics for Terraform Enterprise components, including CPU usage, memory allocation, disk I/O, and network I/O, as well as run pipeline metrics.
For more information about the metrics exposed by Terraform Enterprise, see the documentation at https://www.terraform.io/enterprise/admin/infrastructure/monitoring#metrics-telemetry.
The queries used by the panels in this dashboard were created with a five second scrape_interval and evaluation_interval in Prometheus . The panels may not generate data successfully if your Prometheus configuration is set otherwise. This dashboard is provided as an example for how you could utilize the metrics that are exported out of TFE, but is not meant to be production ready.
Data source config
Collector config:
Upload an updated version of an exported dashboard.json file from Grafana
| Revision | Description | Created | |
|---|---|---|---|
| Download |
Cilium Enterprise
Easily monitor your deployment of Cilium Enterprise with Grafana Cloud's out-of-the-box monitoring solution.
Learn more