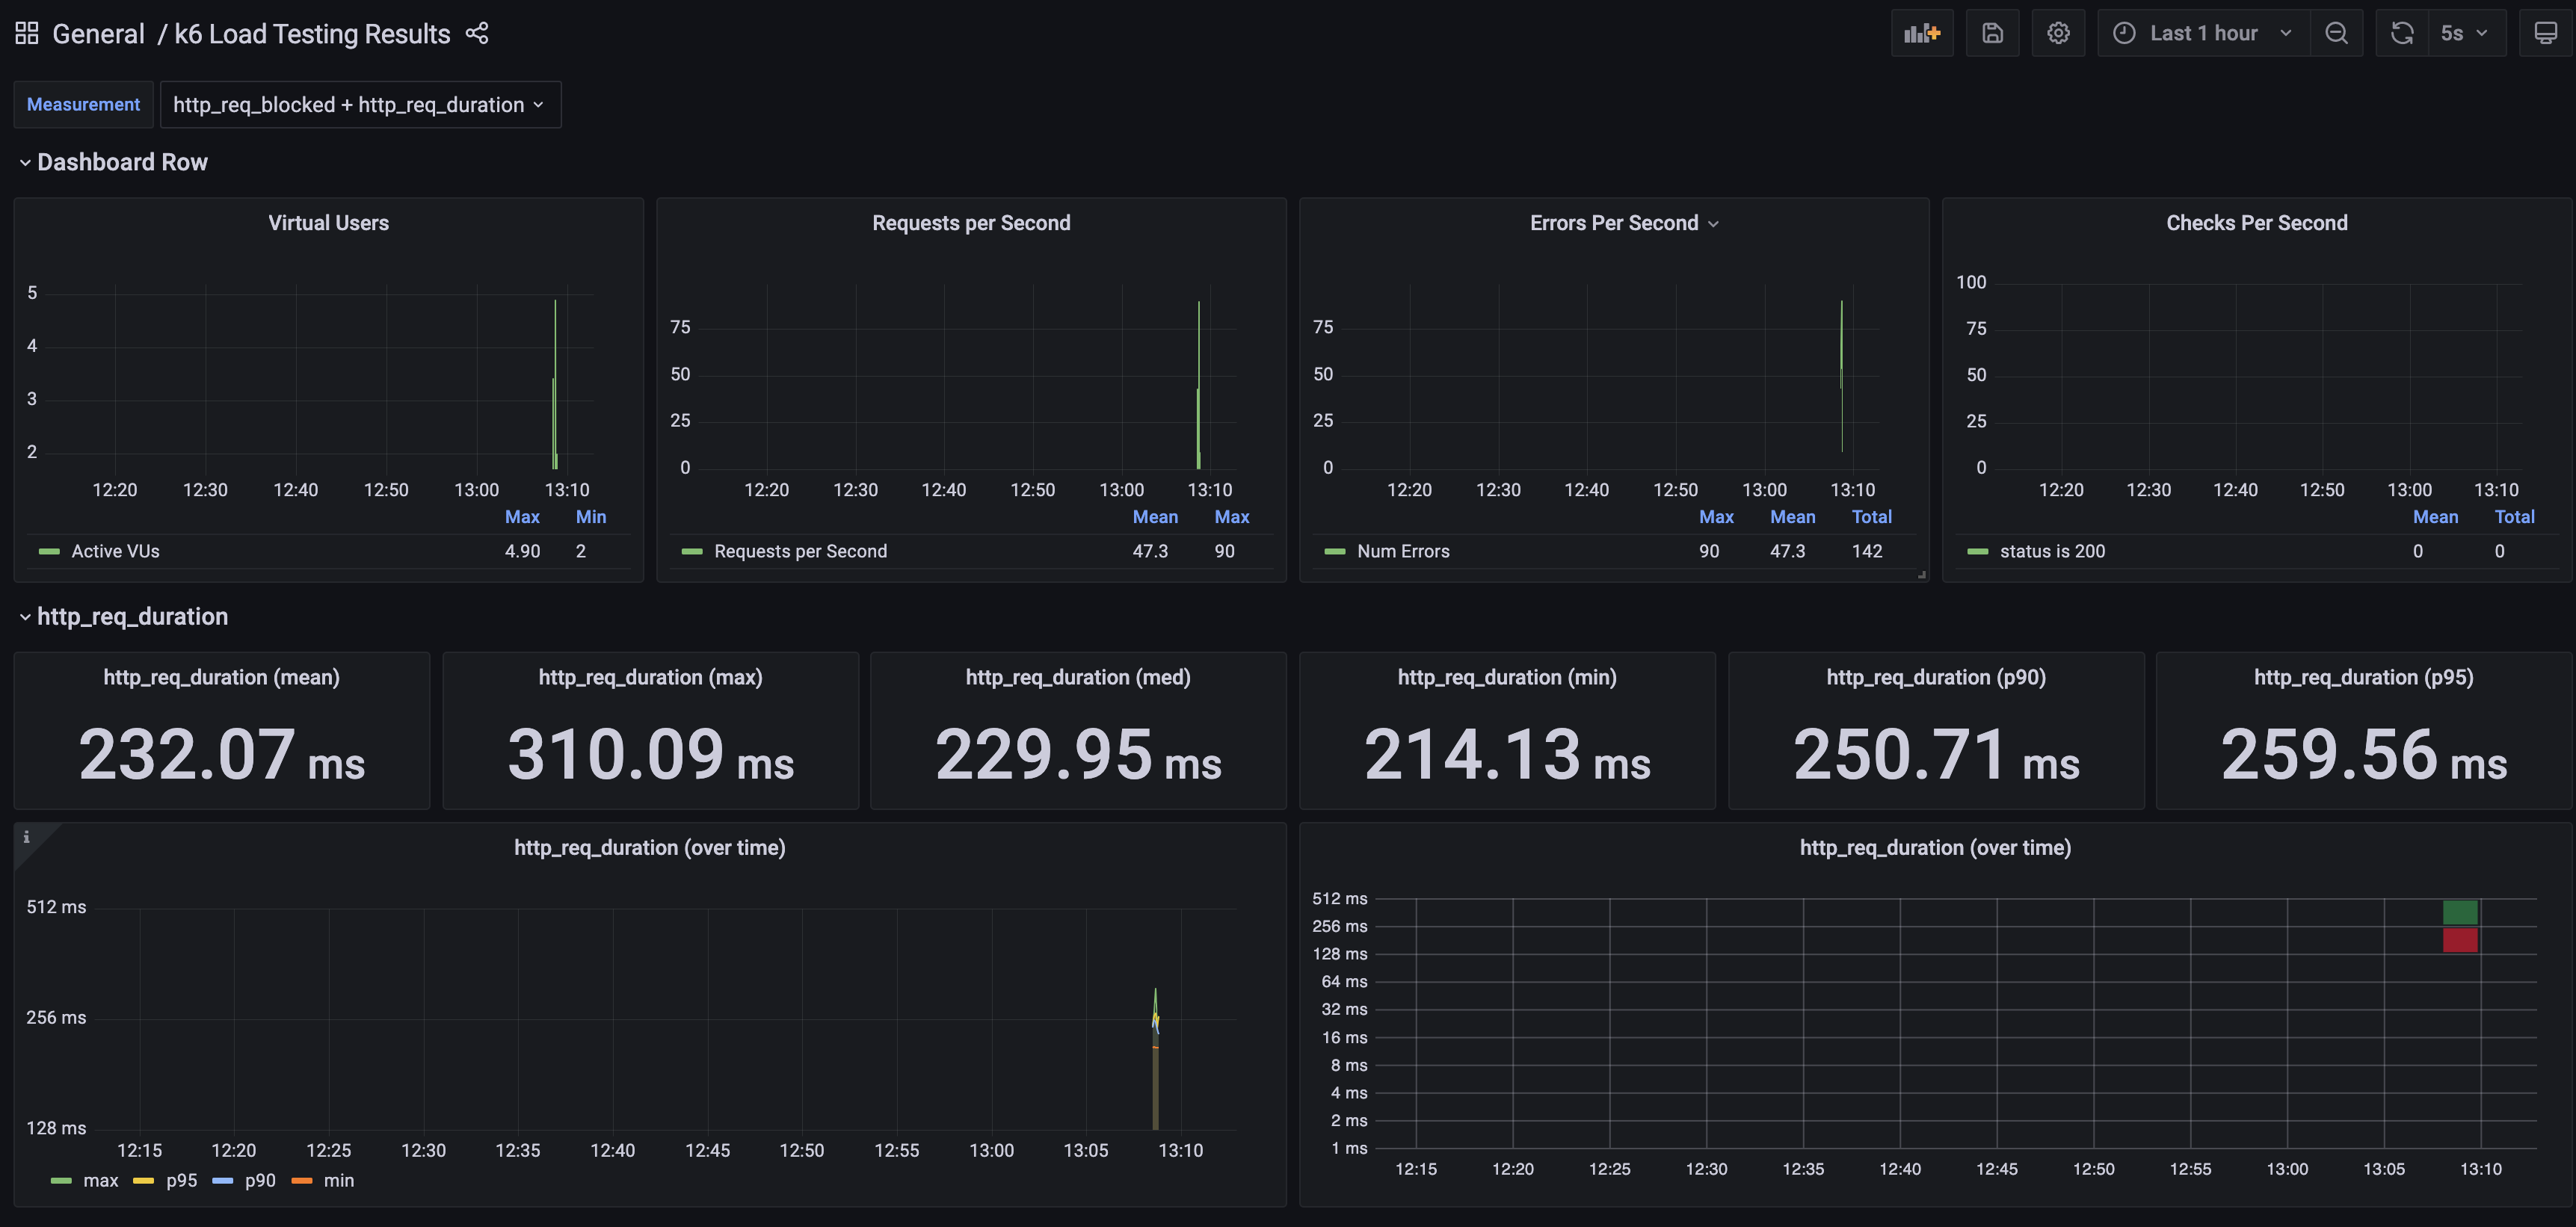
k6 Load Testing Results
A dashboard for visualizing results from the k6.io load testing tool, using the InfluxDB exporter update to last grafana and k6 version
Changelog
All notable changes to this project will be documented in this file.
[1.0.0] - 2022-01-18
Added
- Change old graph panel to time series panel time series
- Add support to http_req_failed metrics in errors per second panel. http-req-failed
More info https://github.com/jwcastillo/docker-k6-grafana-influxdb Influx: 1.8 Grafana: 8.3
Data source config
Collector type:
Collector plugins:
Collector config:
Revisions
Upload an updated version of an exported dashboard.json file from Grafana
| Revision | Description | Created | |
|---|---|---|---|
| Download |