Kubewarden
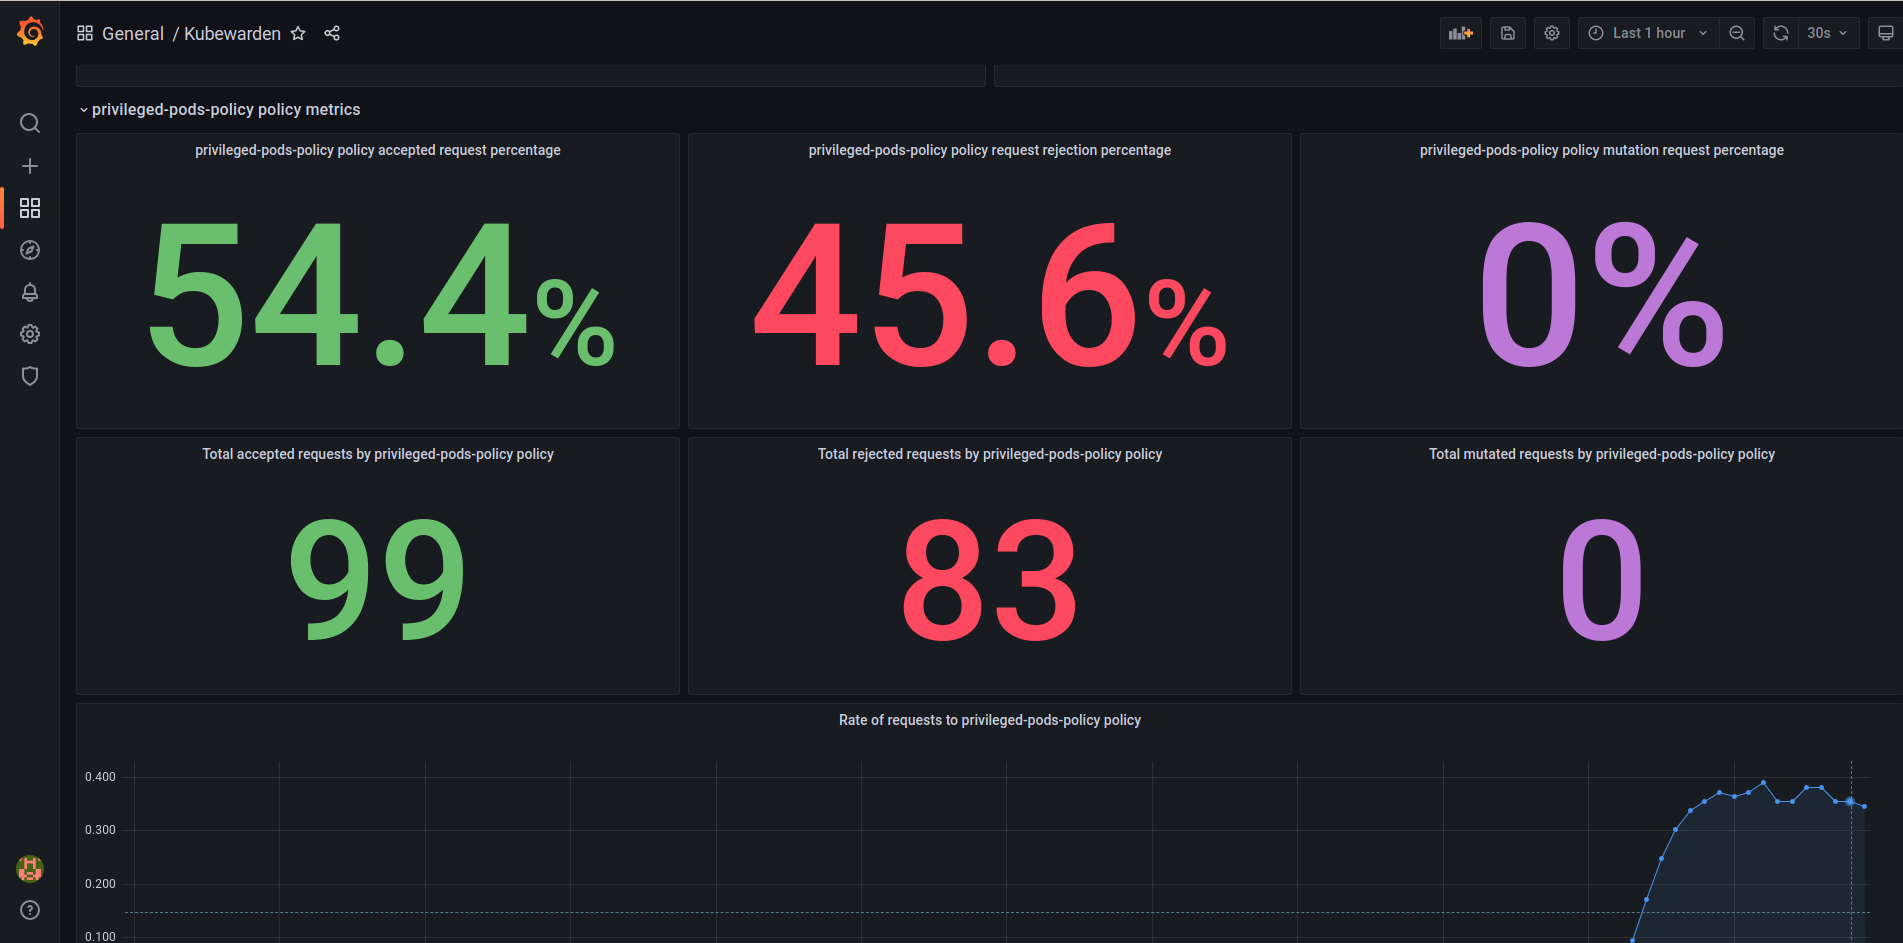
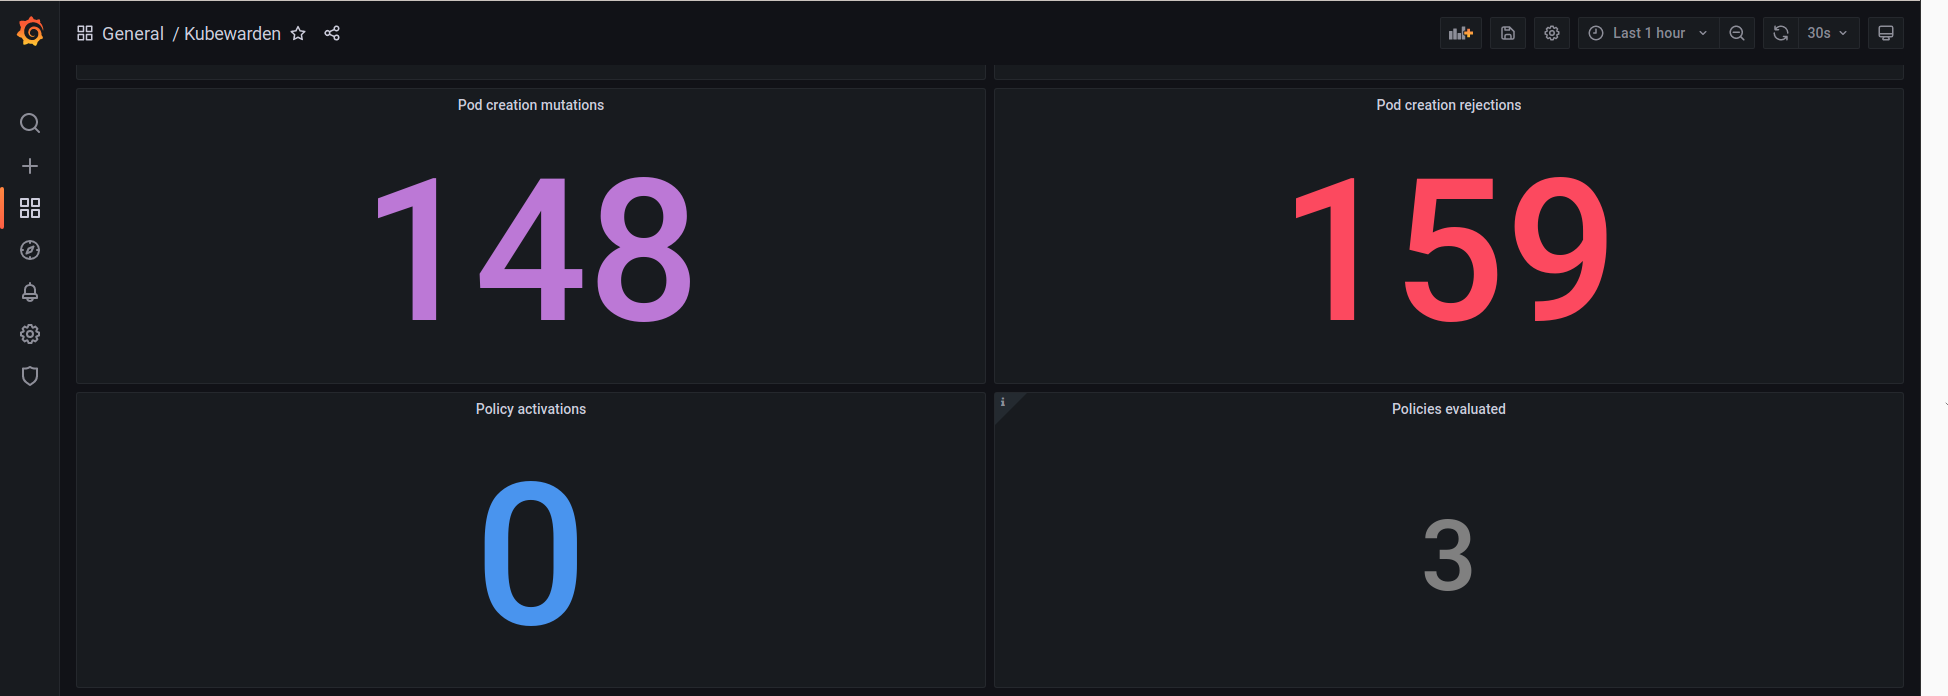
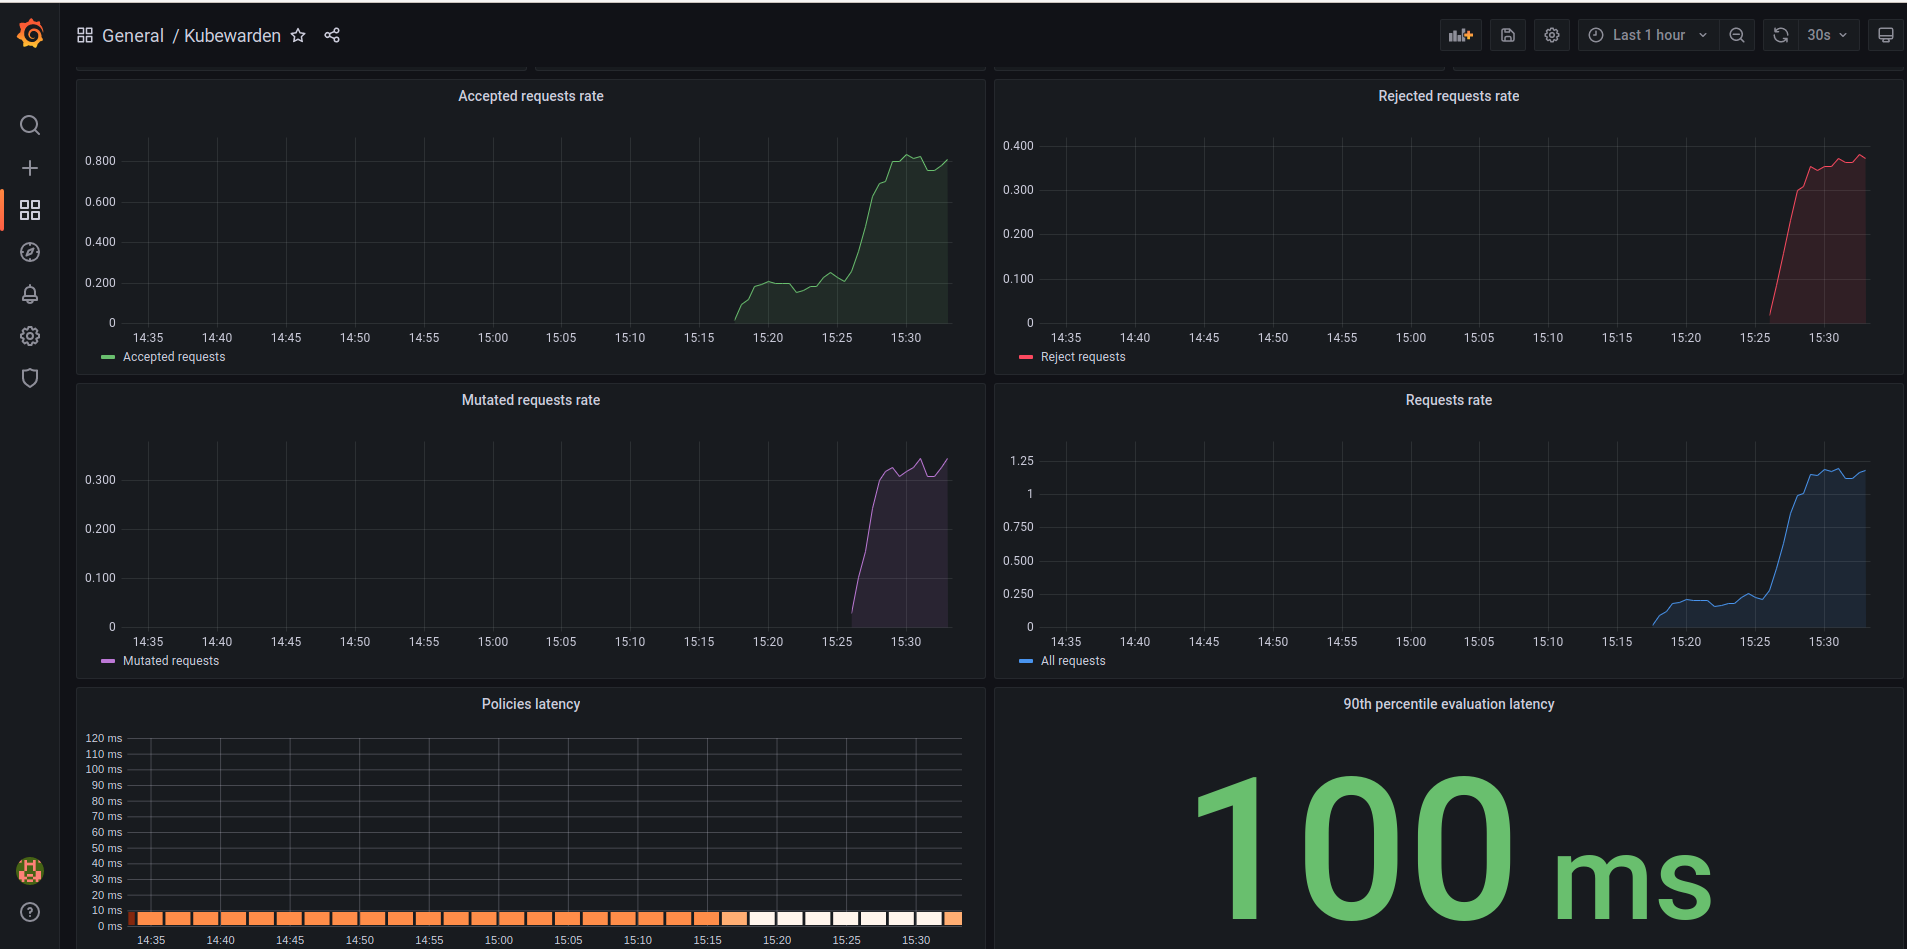
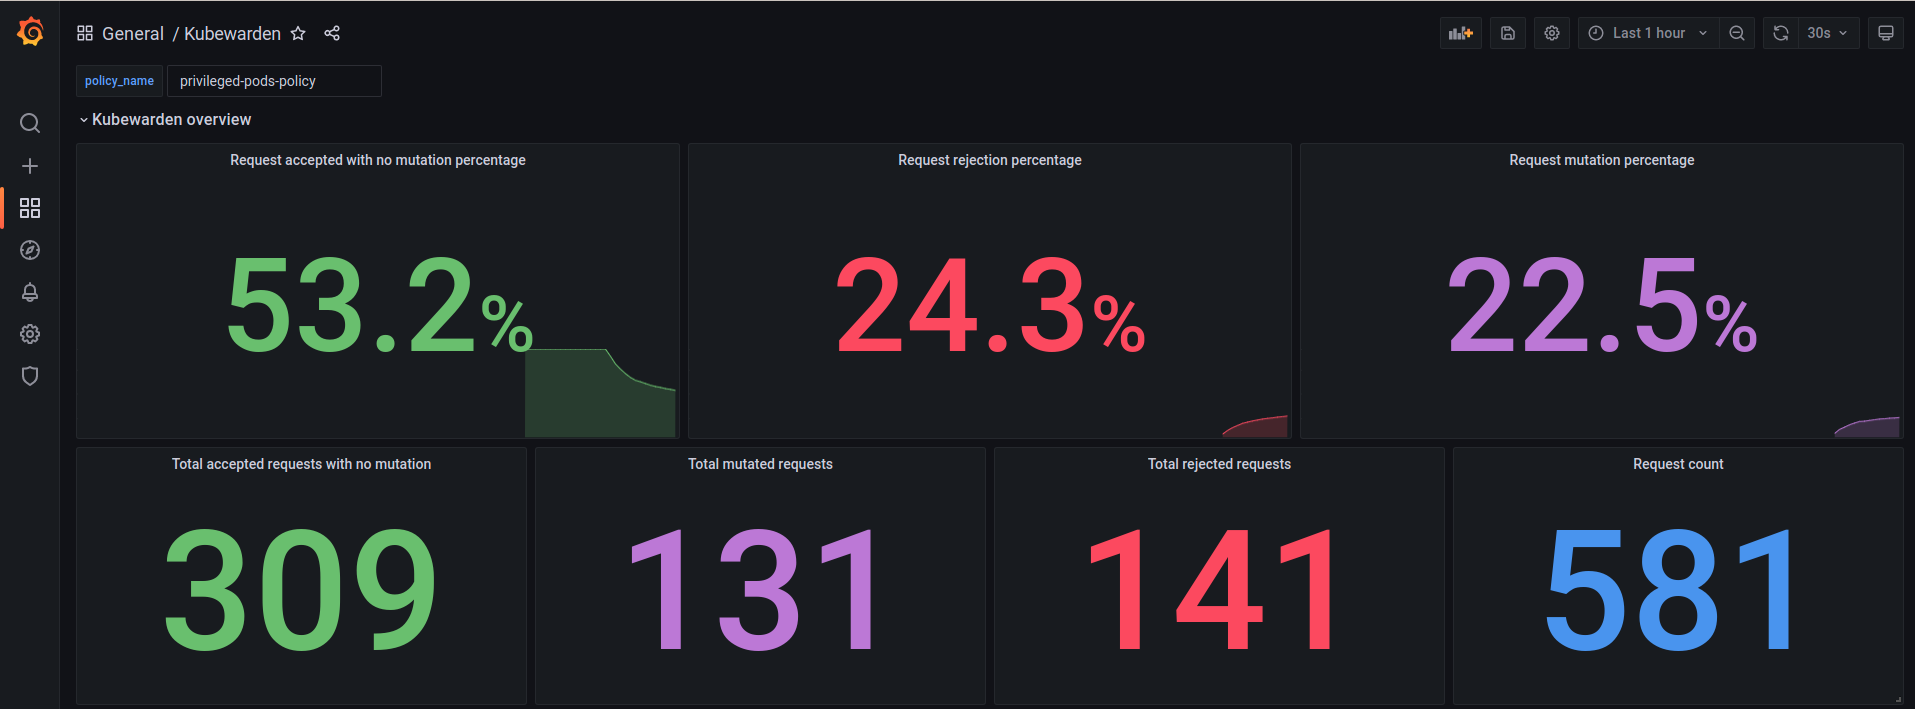

This dashboard has some basic graphics to user monitor their Kubewarden stack. It shows how many requests Kubewarden accepted, rejected, or mutated, the rate of each of request, and latency. As well as allow the user to visualize the same metrics for specific policies
You can find more information in the Kubewarden documentation: https://docs.kubewarden.io/operator-manual/telemetry/metrics/01-quickstart.html
Data source config
Collector type:
Collector plugins:
Collector config:
Revisions
Upload an updated version of an exported dashboard.json file from Grafana
| Revision | Description | Created | |
|---|---|---|---|
| Download |