Prometheus Web Service Exporter
Prometheus Web Service Exporter
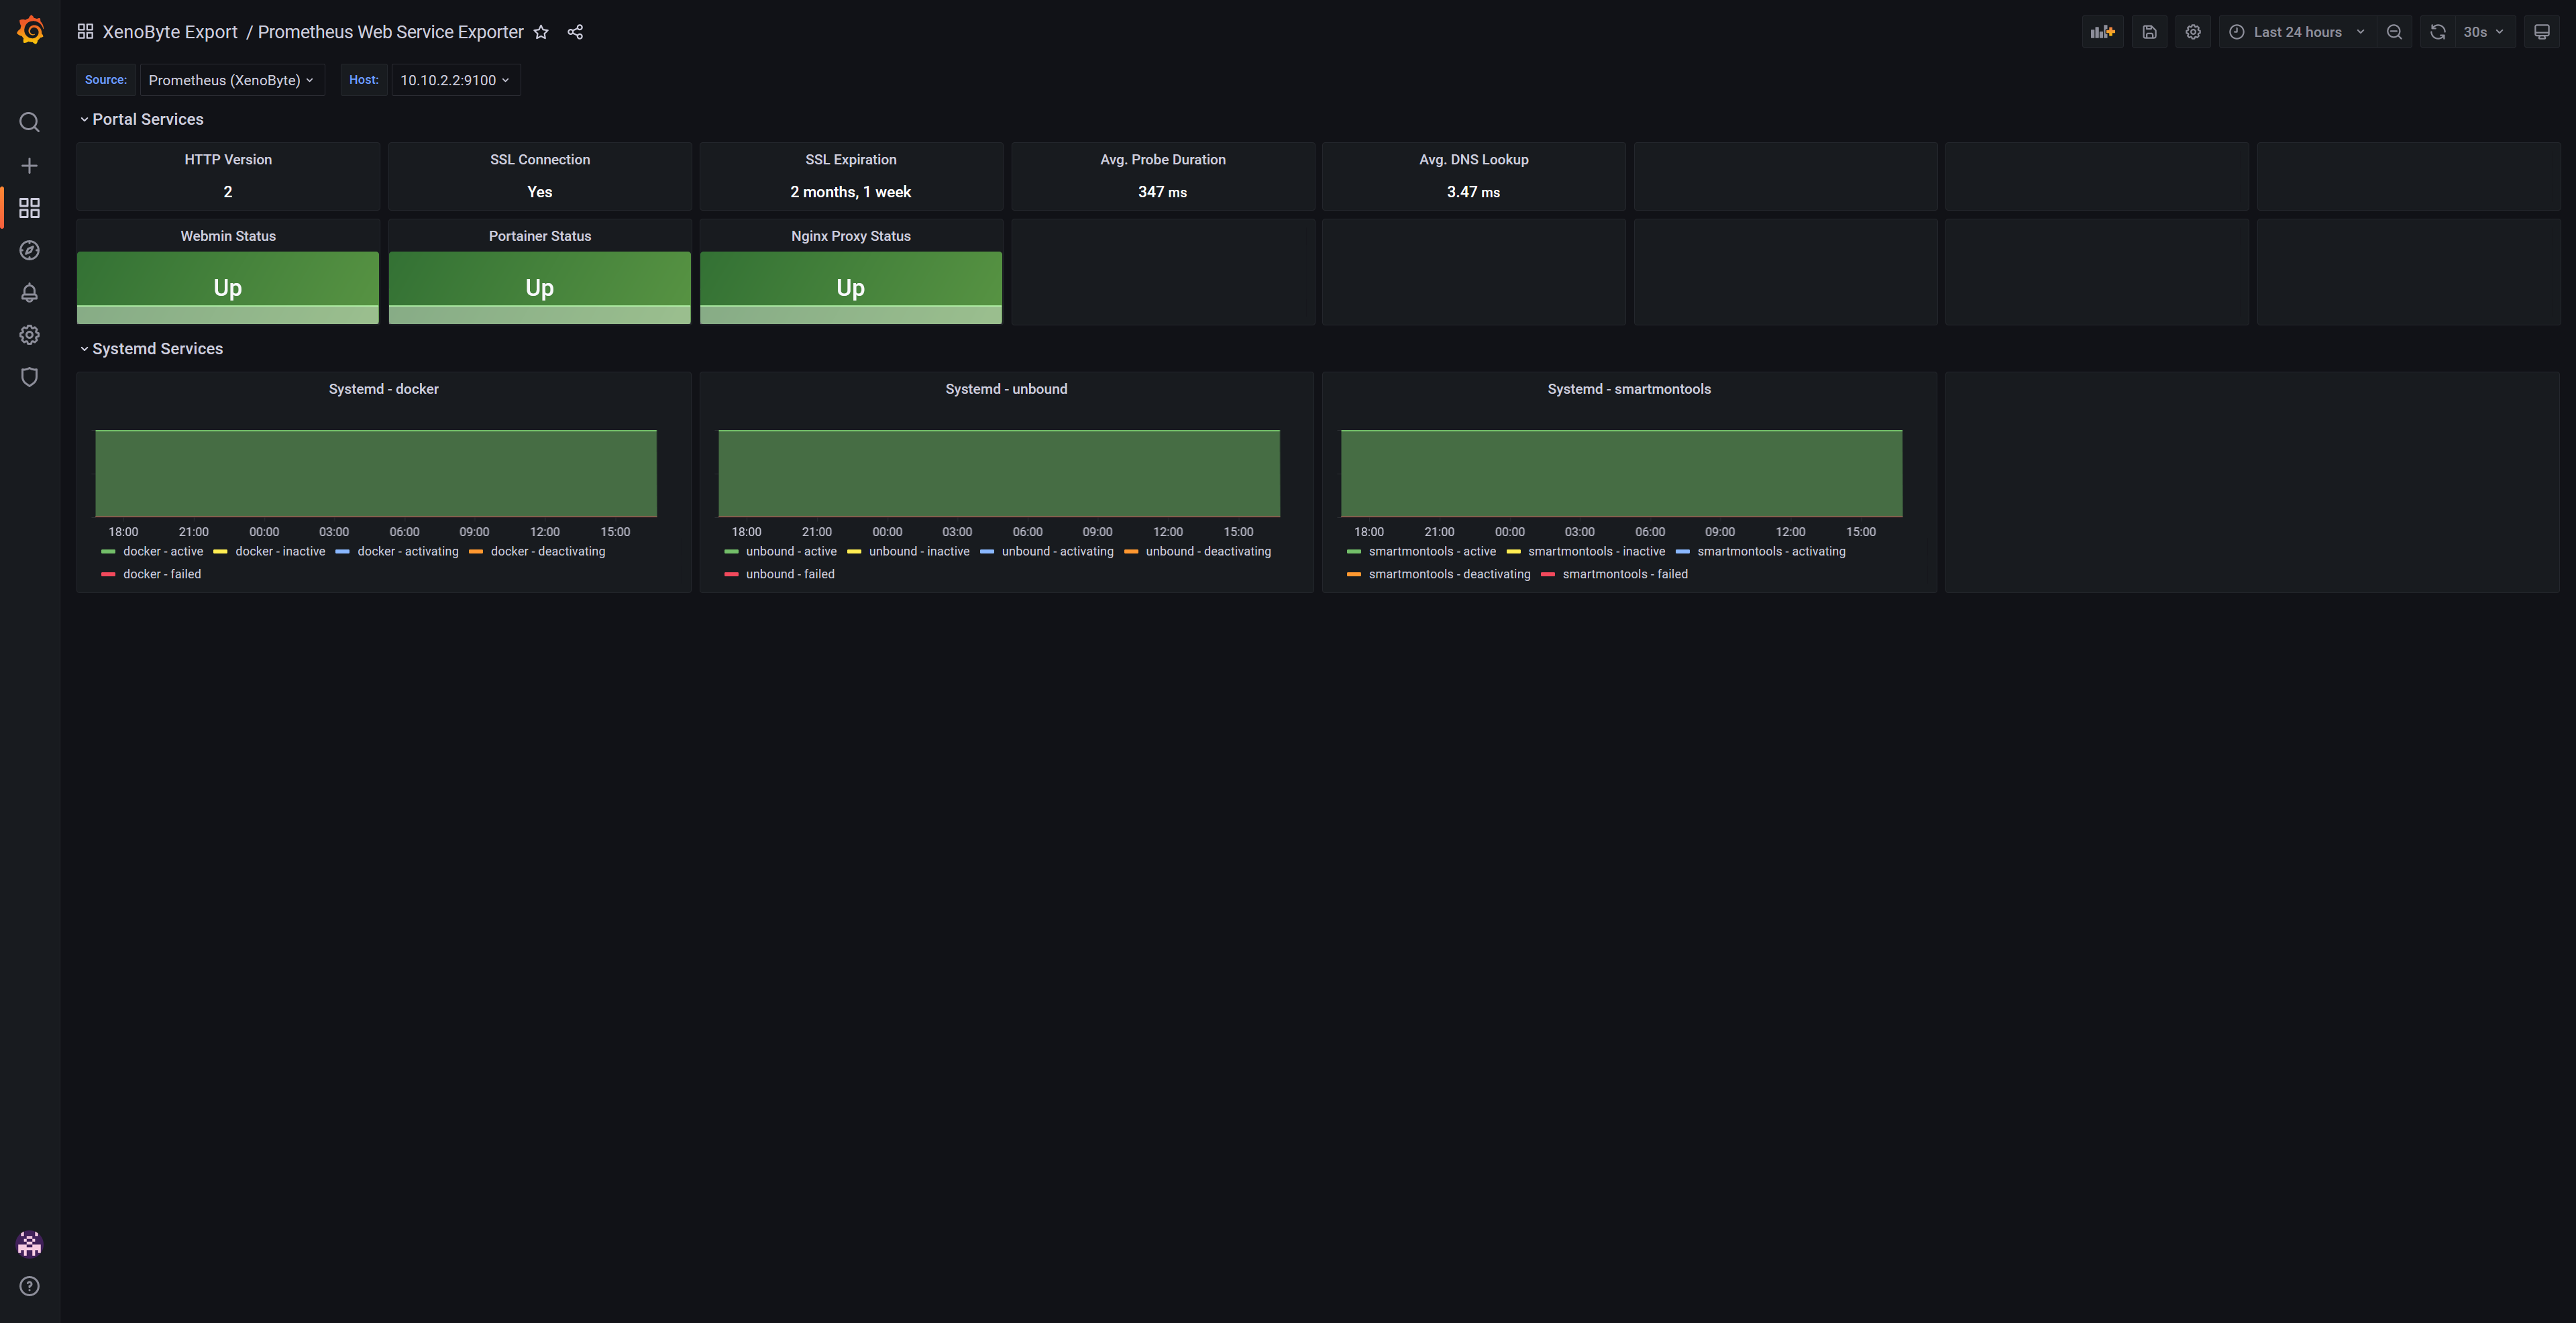
This dashboard gives an overview of HTTP stats and selected web services (from Blackbox Exporter), as well as status for selected systemd services (from Node Exporter).
Uses Prometheus with the following exporters:
- Node Exporter
- Blackbox Exporter
With Grafana variables/constants, you can easily add:
- More web services
- More systemd services
Data source config
Collector type:
Collector plugins:
Collector config:
Revisions
Upload an updated version of an exported dashboard.json file from Grafana
| Revision | Description | Created | |
|---|---|---|---|
| Download |
Metrics Endpoint (Prometheus)
Easily monitor any Prometheus-compatible and publicly accessible metrics URL with Grafana Cloud's out-of-the-box monitoring solution.
Learn more