Prometheus Home Dashboard
Prometheus Home Dashboard
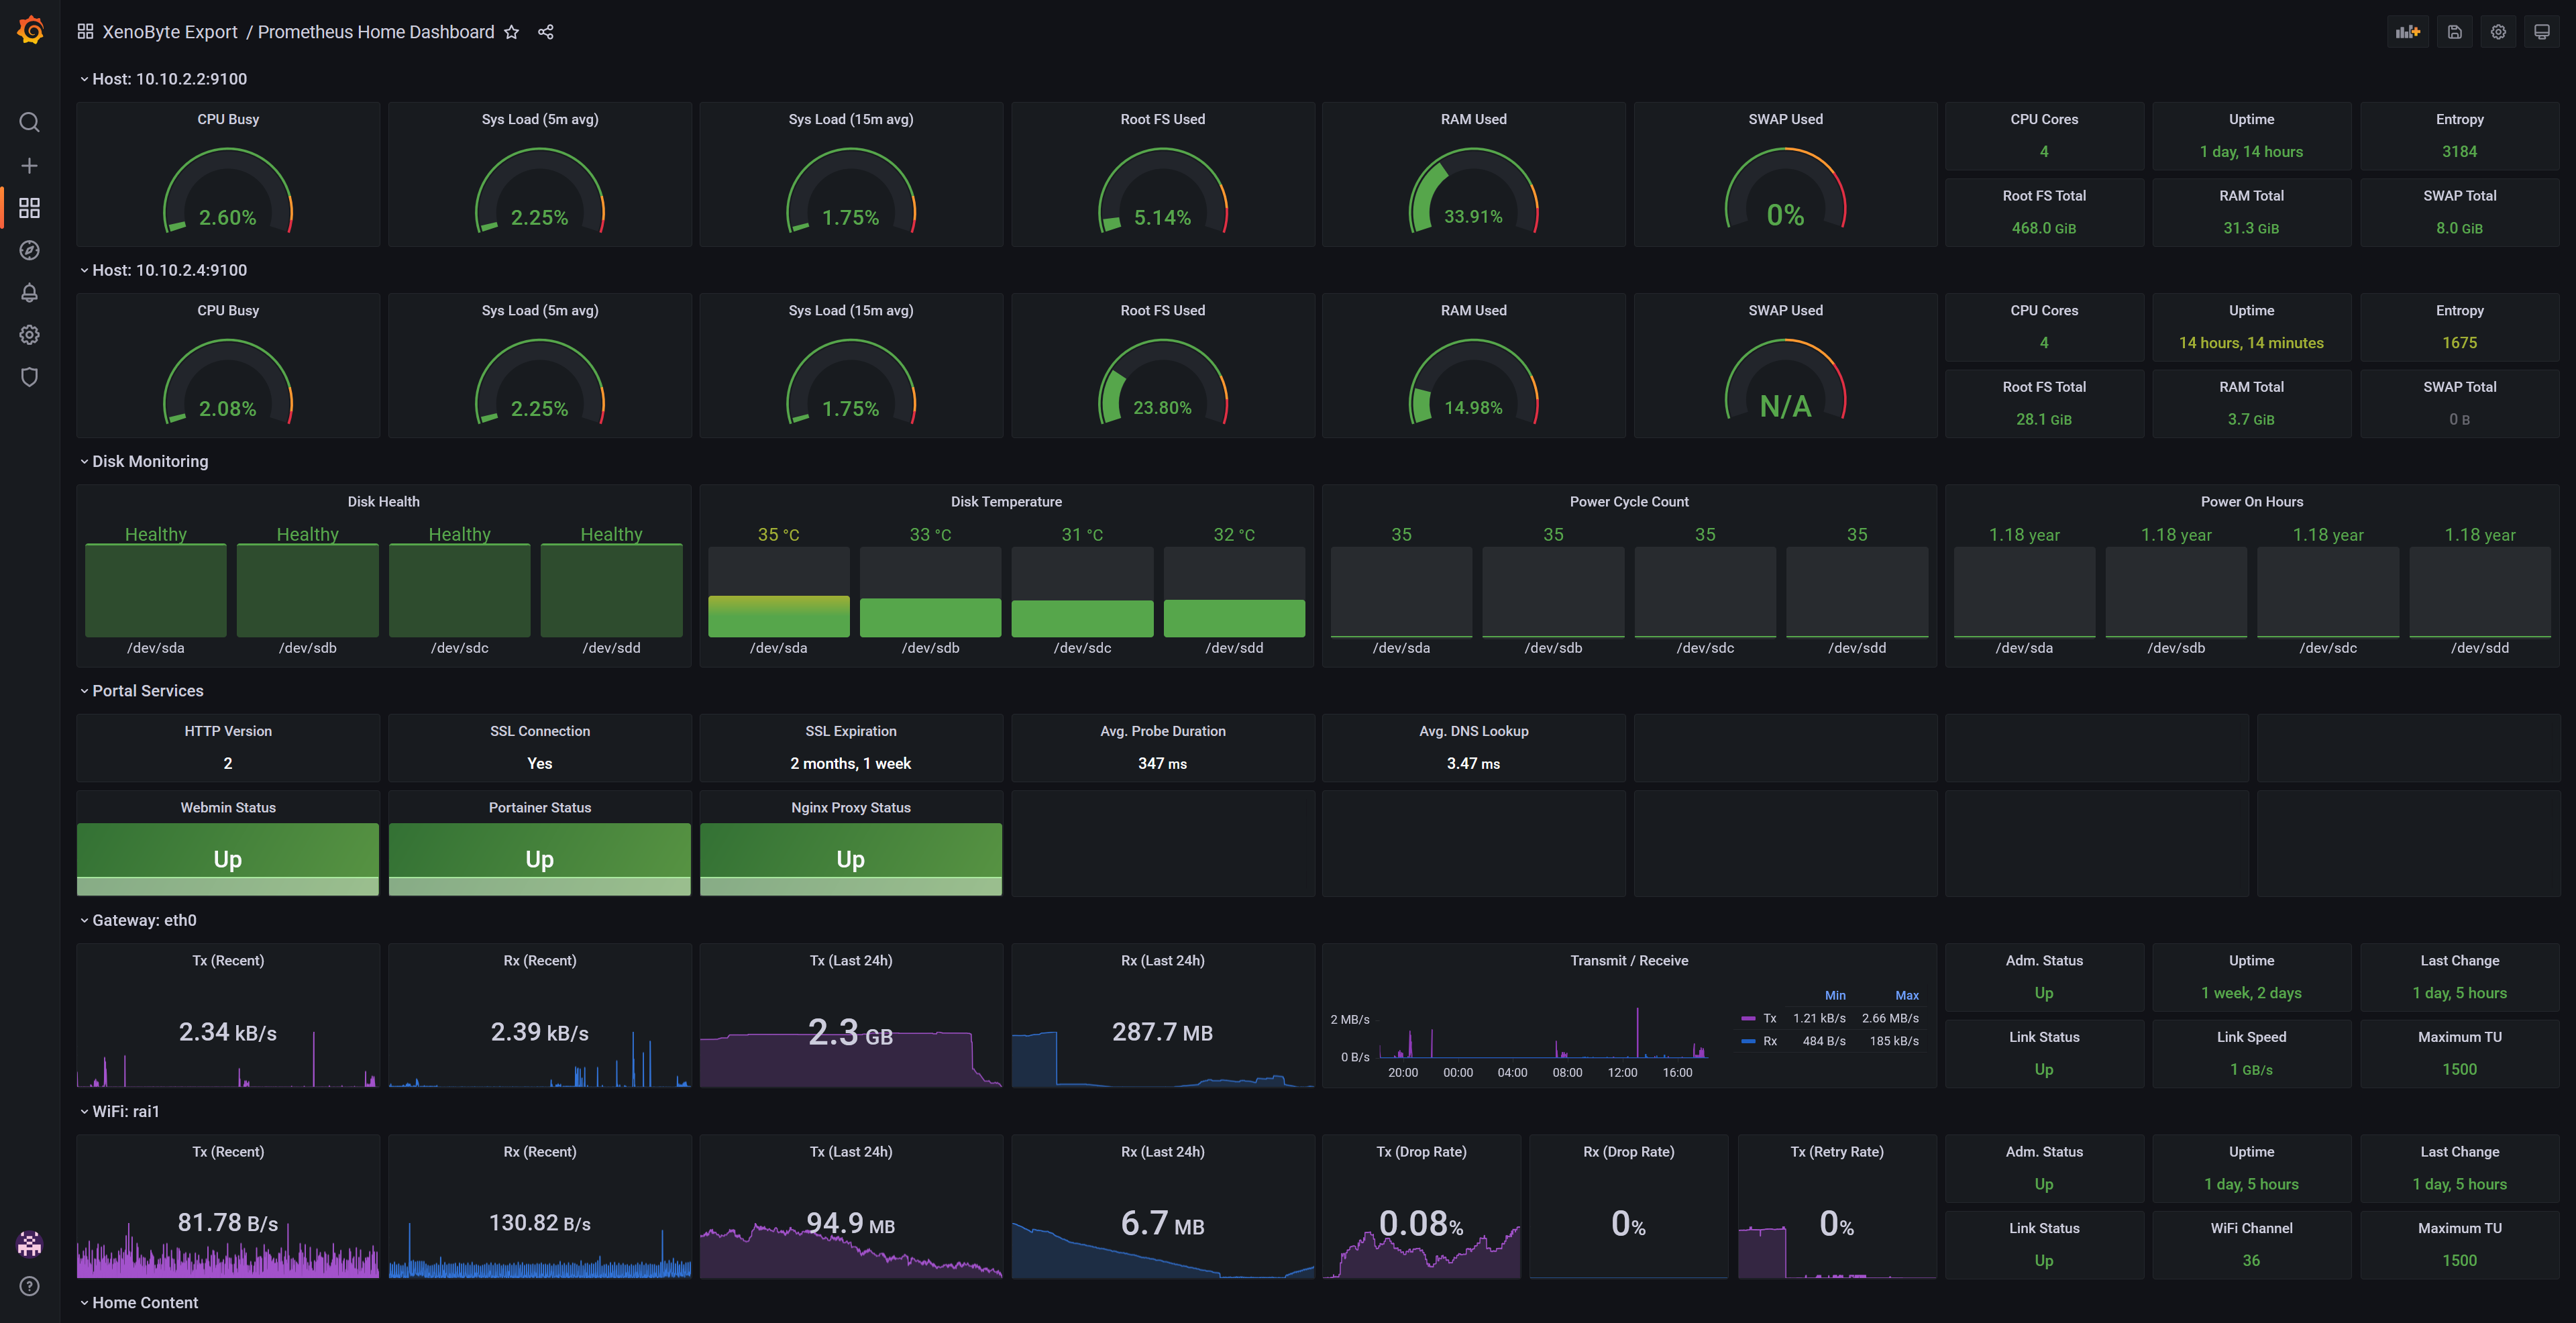
This dashboard gives a quick overview of your hosts, disk monitoring, web services and network (Gateway and Unifi AP's). This is a mashup of my 3 other dashboards.
Uses Prometheus with the following exporters:
- Node Exporter
- Blackbox Exporter
- SNMP Exporter
With Grafana variables/constants, you can easily add:
- More hosts
- More disks
- More web services
- More ports/radios
Thanks to rfraile for the Node Exporter Full Dashboard, which served as inspiration for the host overview here.
Data source config
Collector type:
Collector plugins:
Collector config:
Revisions
Upload an updated version of an exported dashboard.json file from Grafana
| Revision | Description | Created | |
|---|---|---|---|
| Download |
Home Assistant
Easily monitor Home Assistant, an open source software platform designed for home automation, with Grafana Cloud's out-of-the-box monitoring solution.
Learn more