External DNS
Grafana dashboard to display external-dns metrics
This dashboard requires external-dns to be running in the kubernetes cluster, this has been tested with
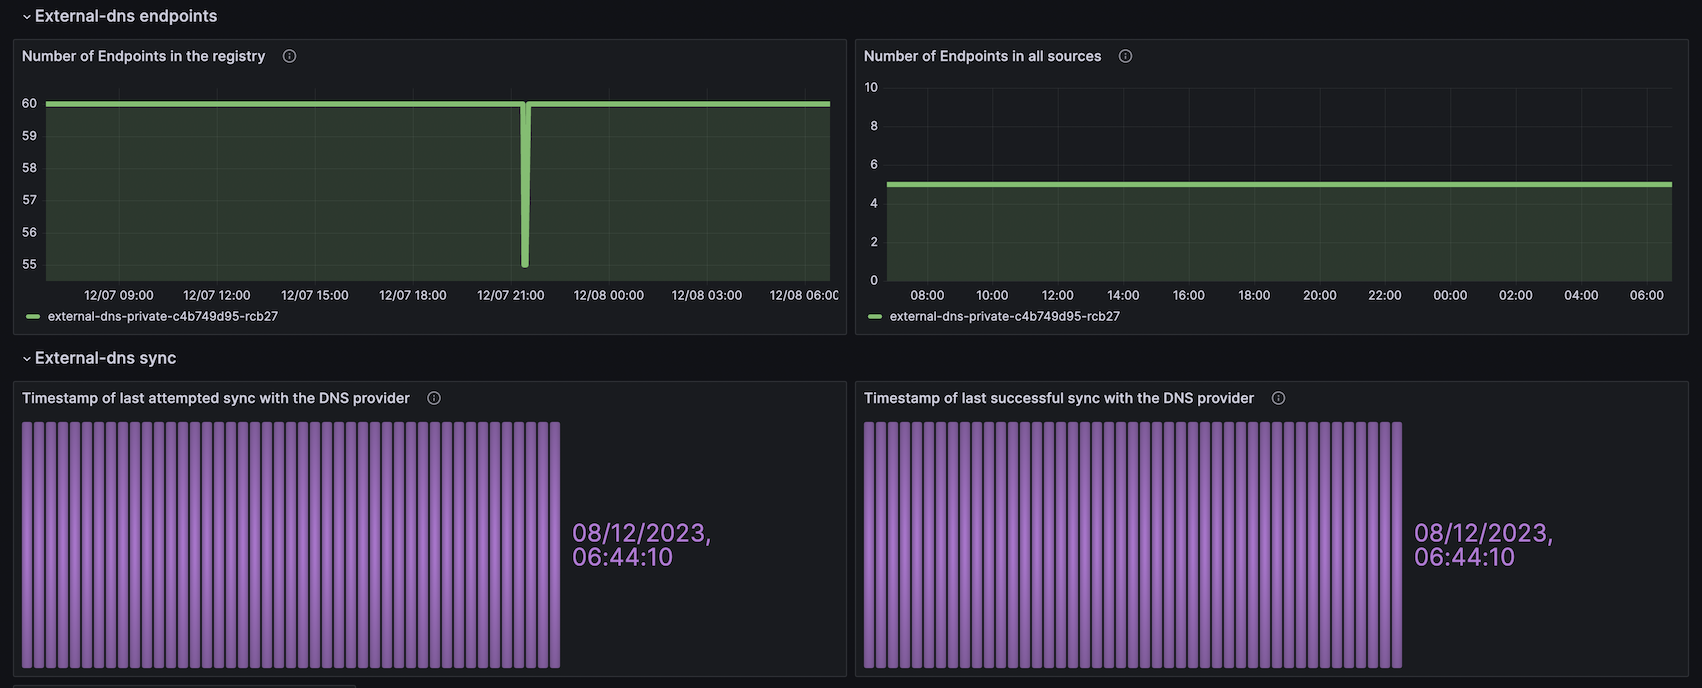
Dashboard displays external-dns metrics
- external_dns_controller_last_sync_timestamp_seconds
- external_dns_controller_last_reconcile_timestamp_seconds
- external_dns_registry_endpoints_total
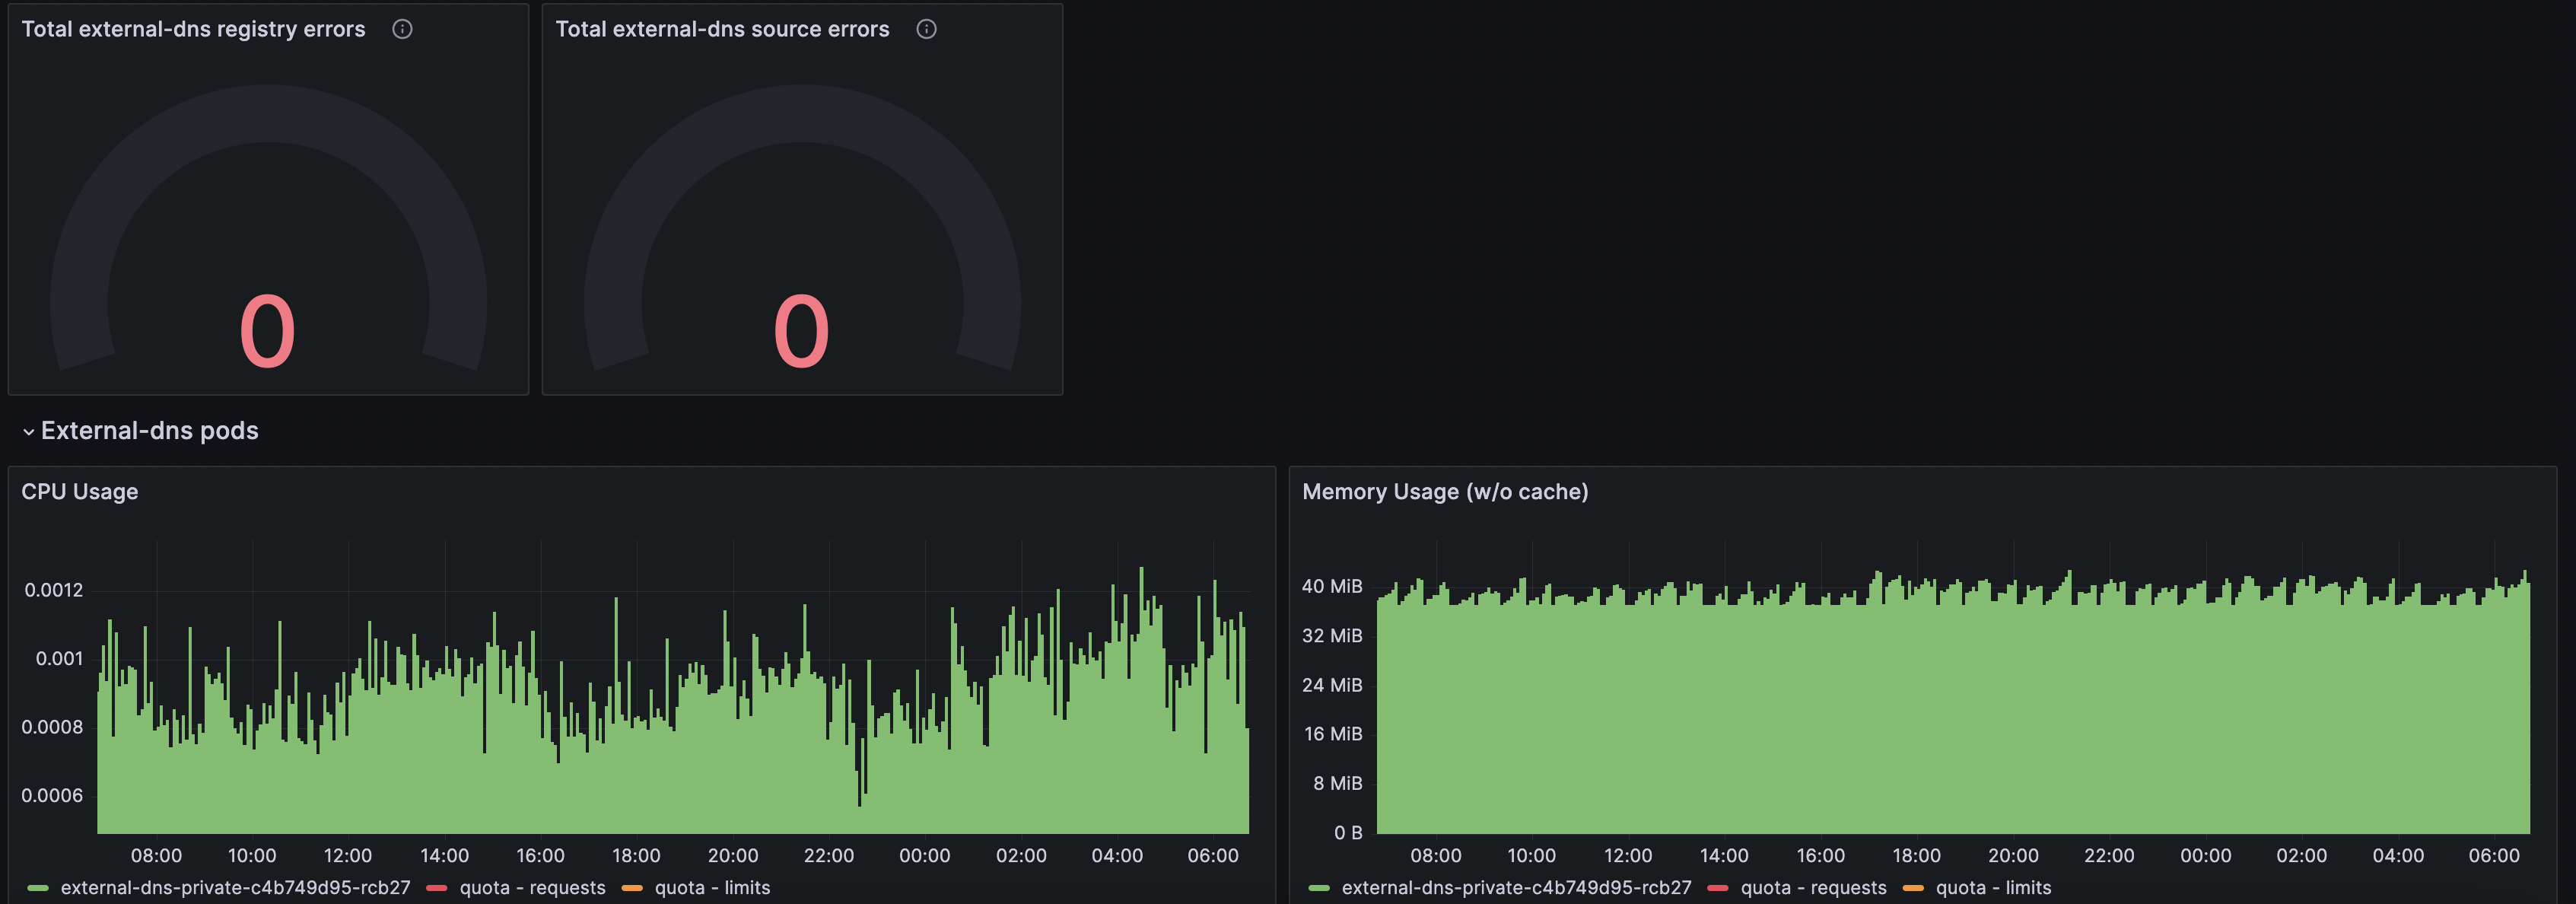
- external_dns_registry_errors_total
- external_dns_source_endpoints_total
- external_dns_source_errors_total
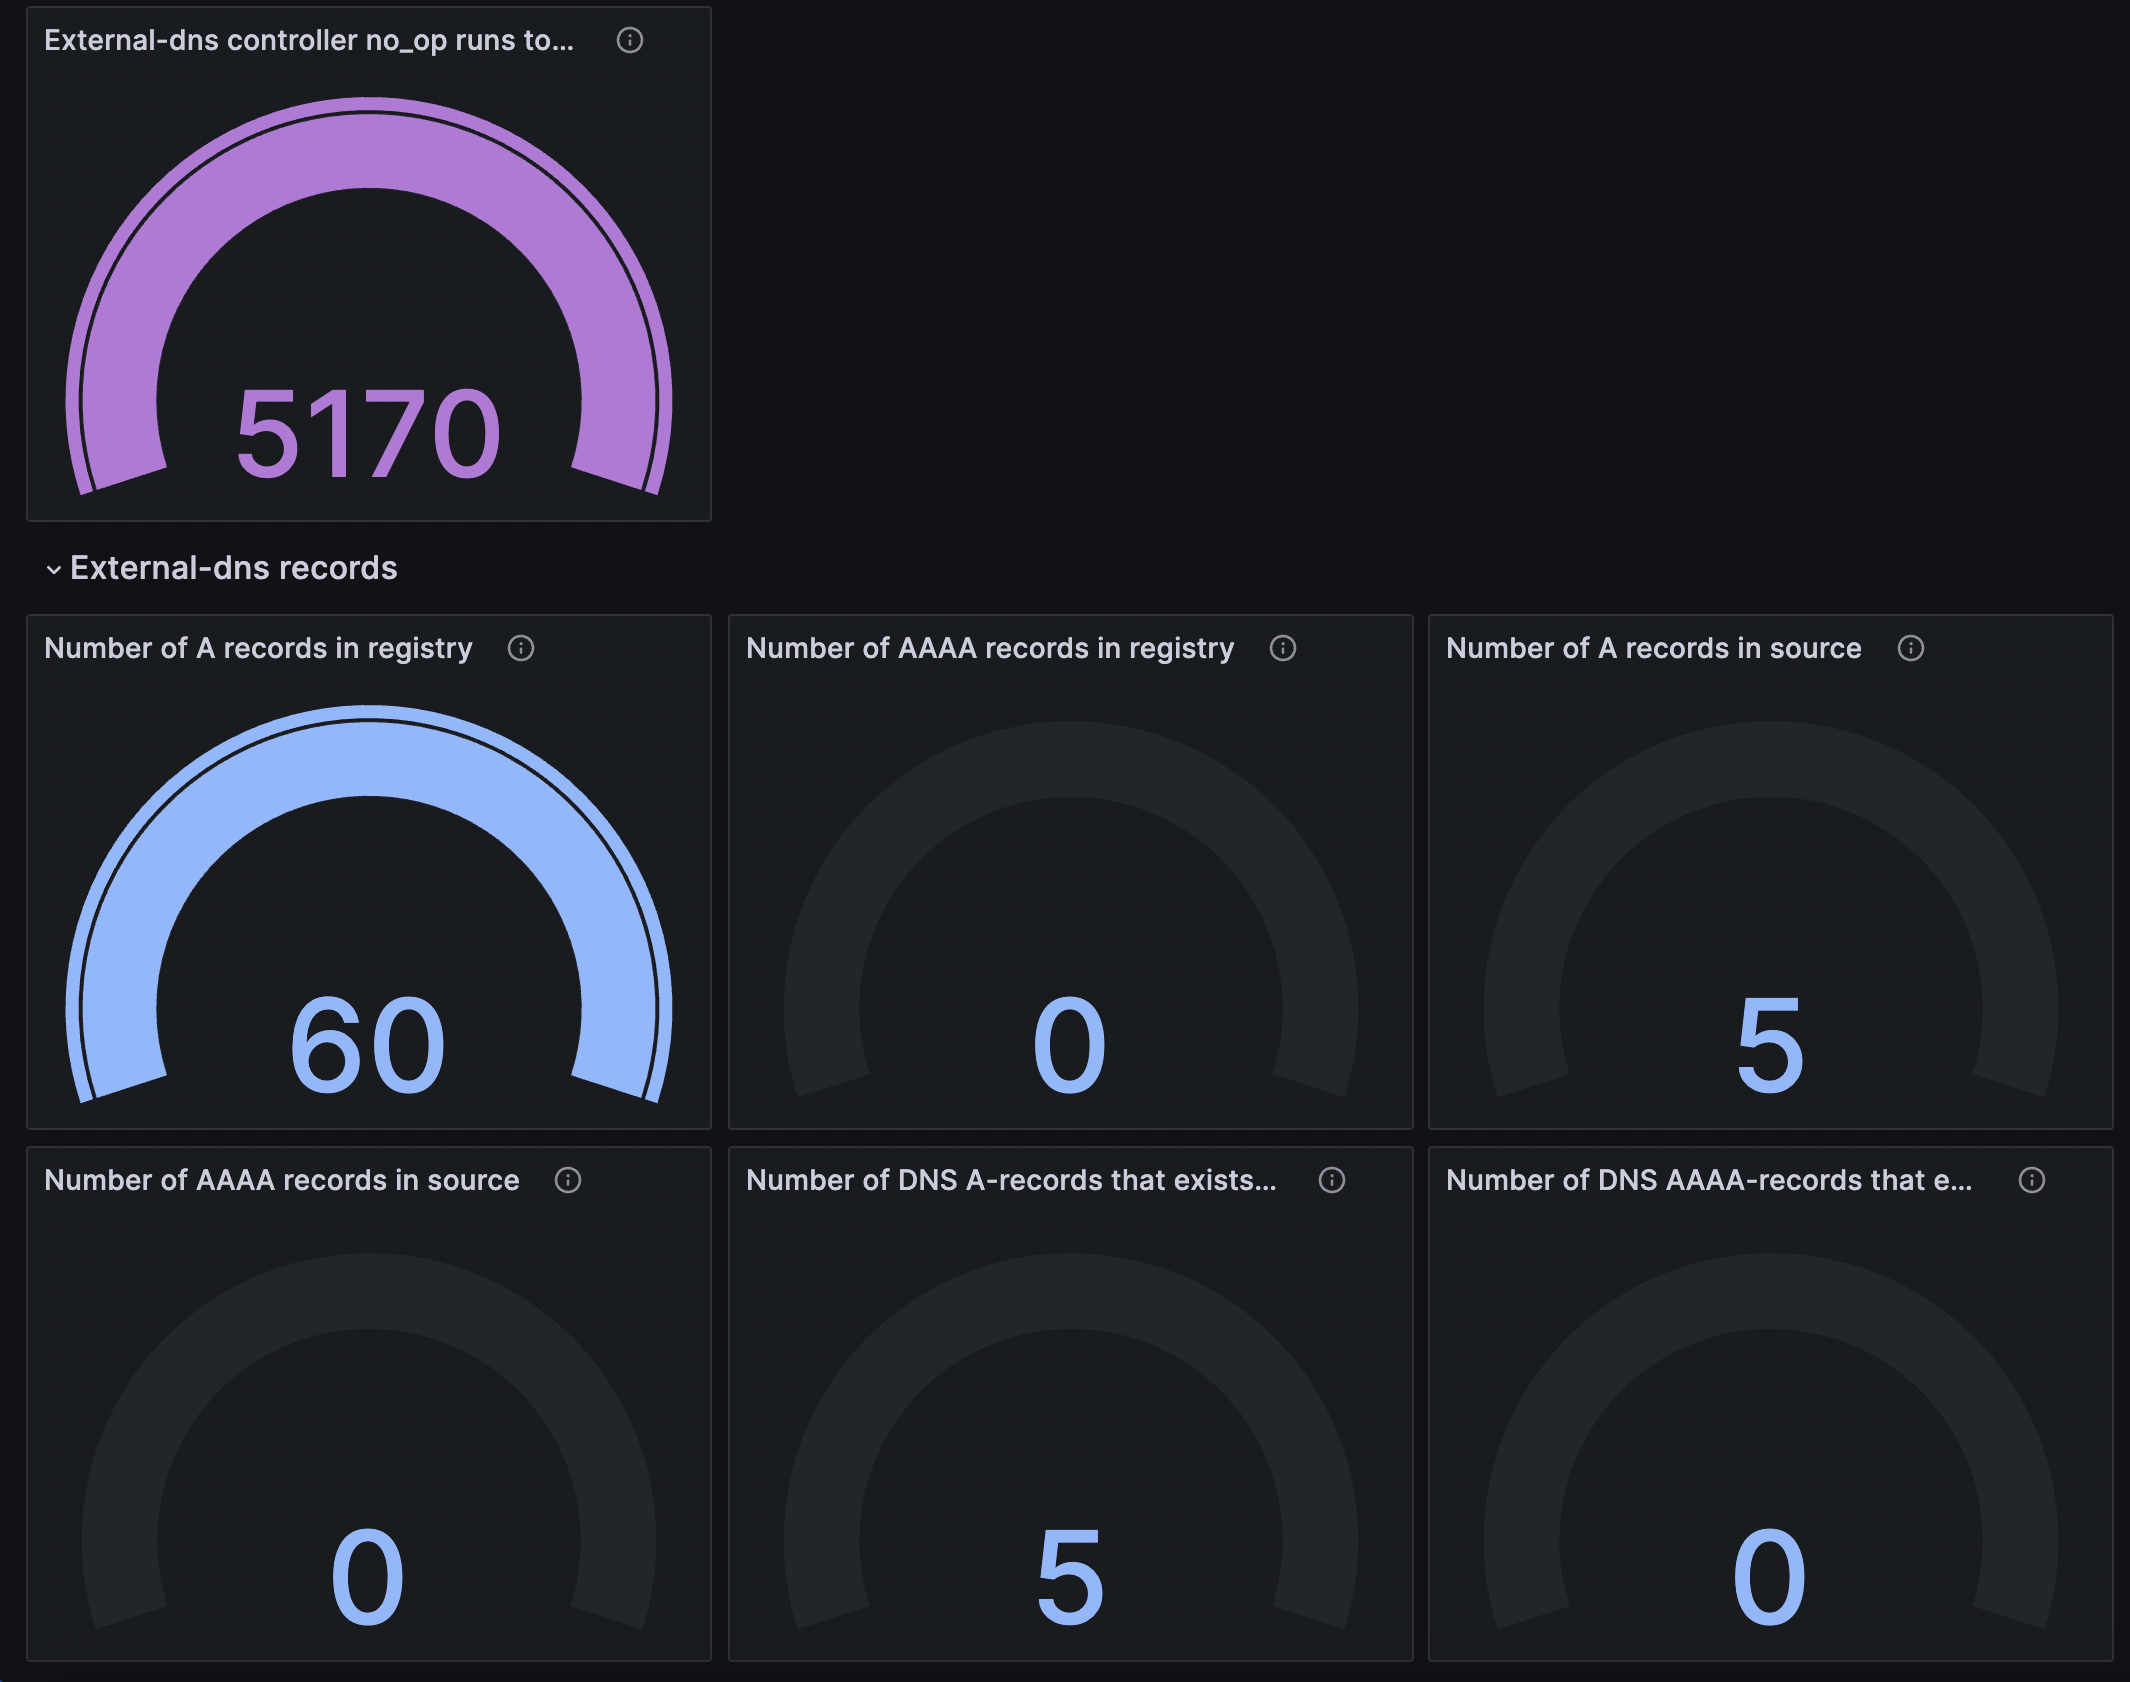
- external_dns_controller_verified_a_records
- external_dns_controller_verified_aaaa_records
- external_dns_registry_a_records
- external_dns_registry_aaaa_records
- external_dns_source_a_records
- external_dns_source_aaaa_records
- external_dns_controller_no_op_runs_total
Data source config
Collector type:
Collector plugins:
Collector config:
Revisions
Upload an updated version of an exported dashboard.json file from Grafana
| Revision | Description | Created | |
|---|---|---|---|
| Download |