Kubernetes cluster monitoring. Powered by Prometheus
Summary metrics about containers running on Kubernetes nodes. This version does not require you to setup the Kubernetes-app plugin. (https://github.com/grafana/kubernetes-app).
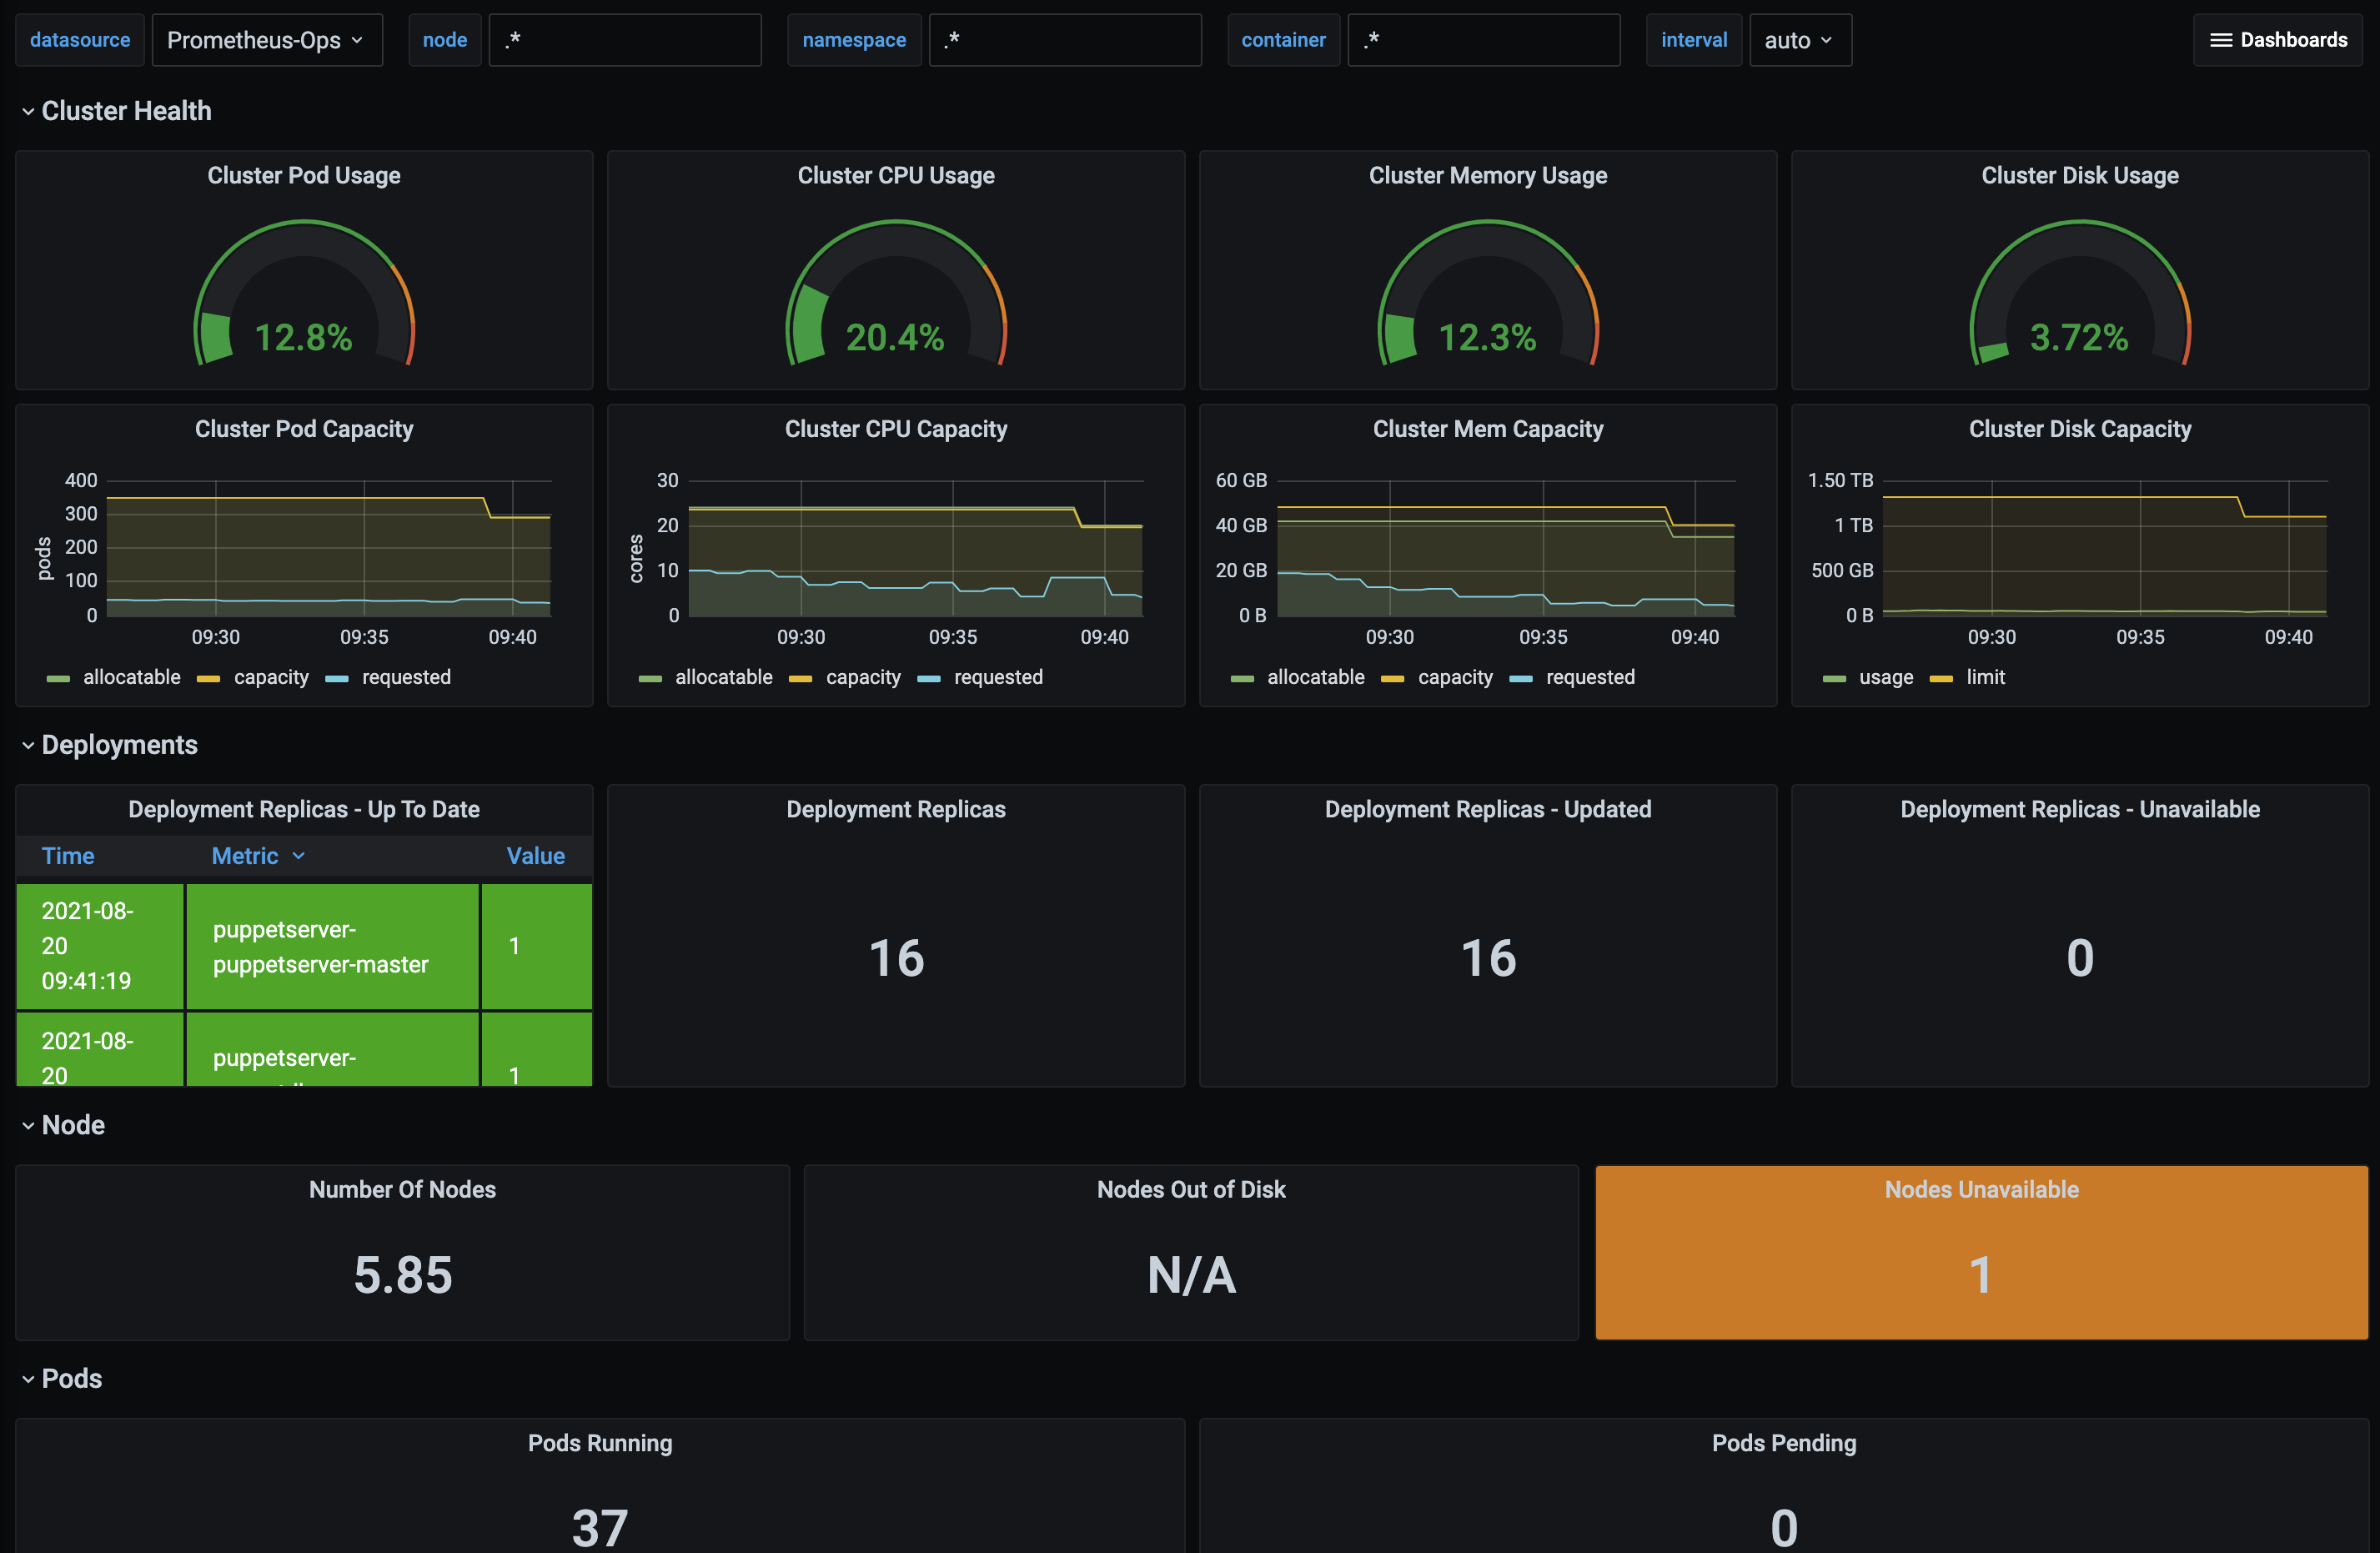
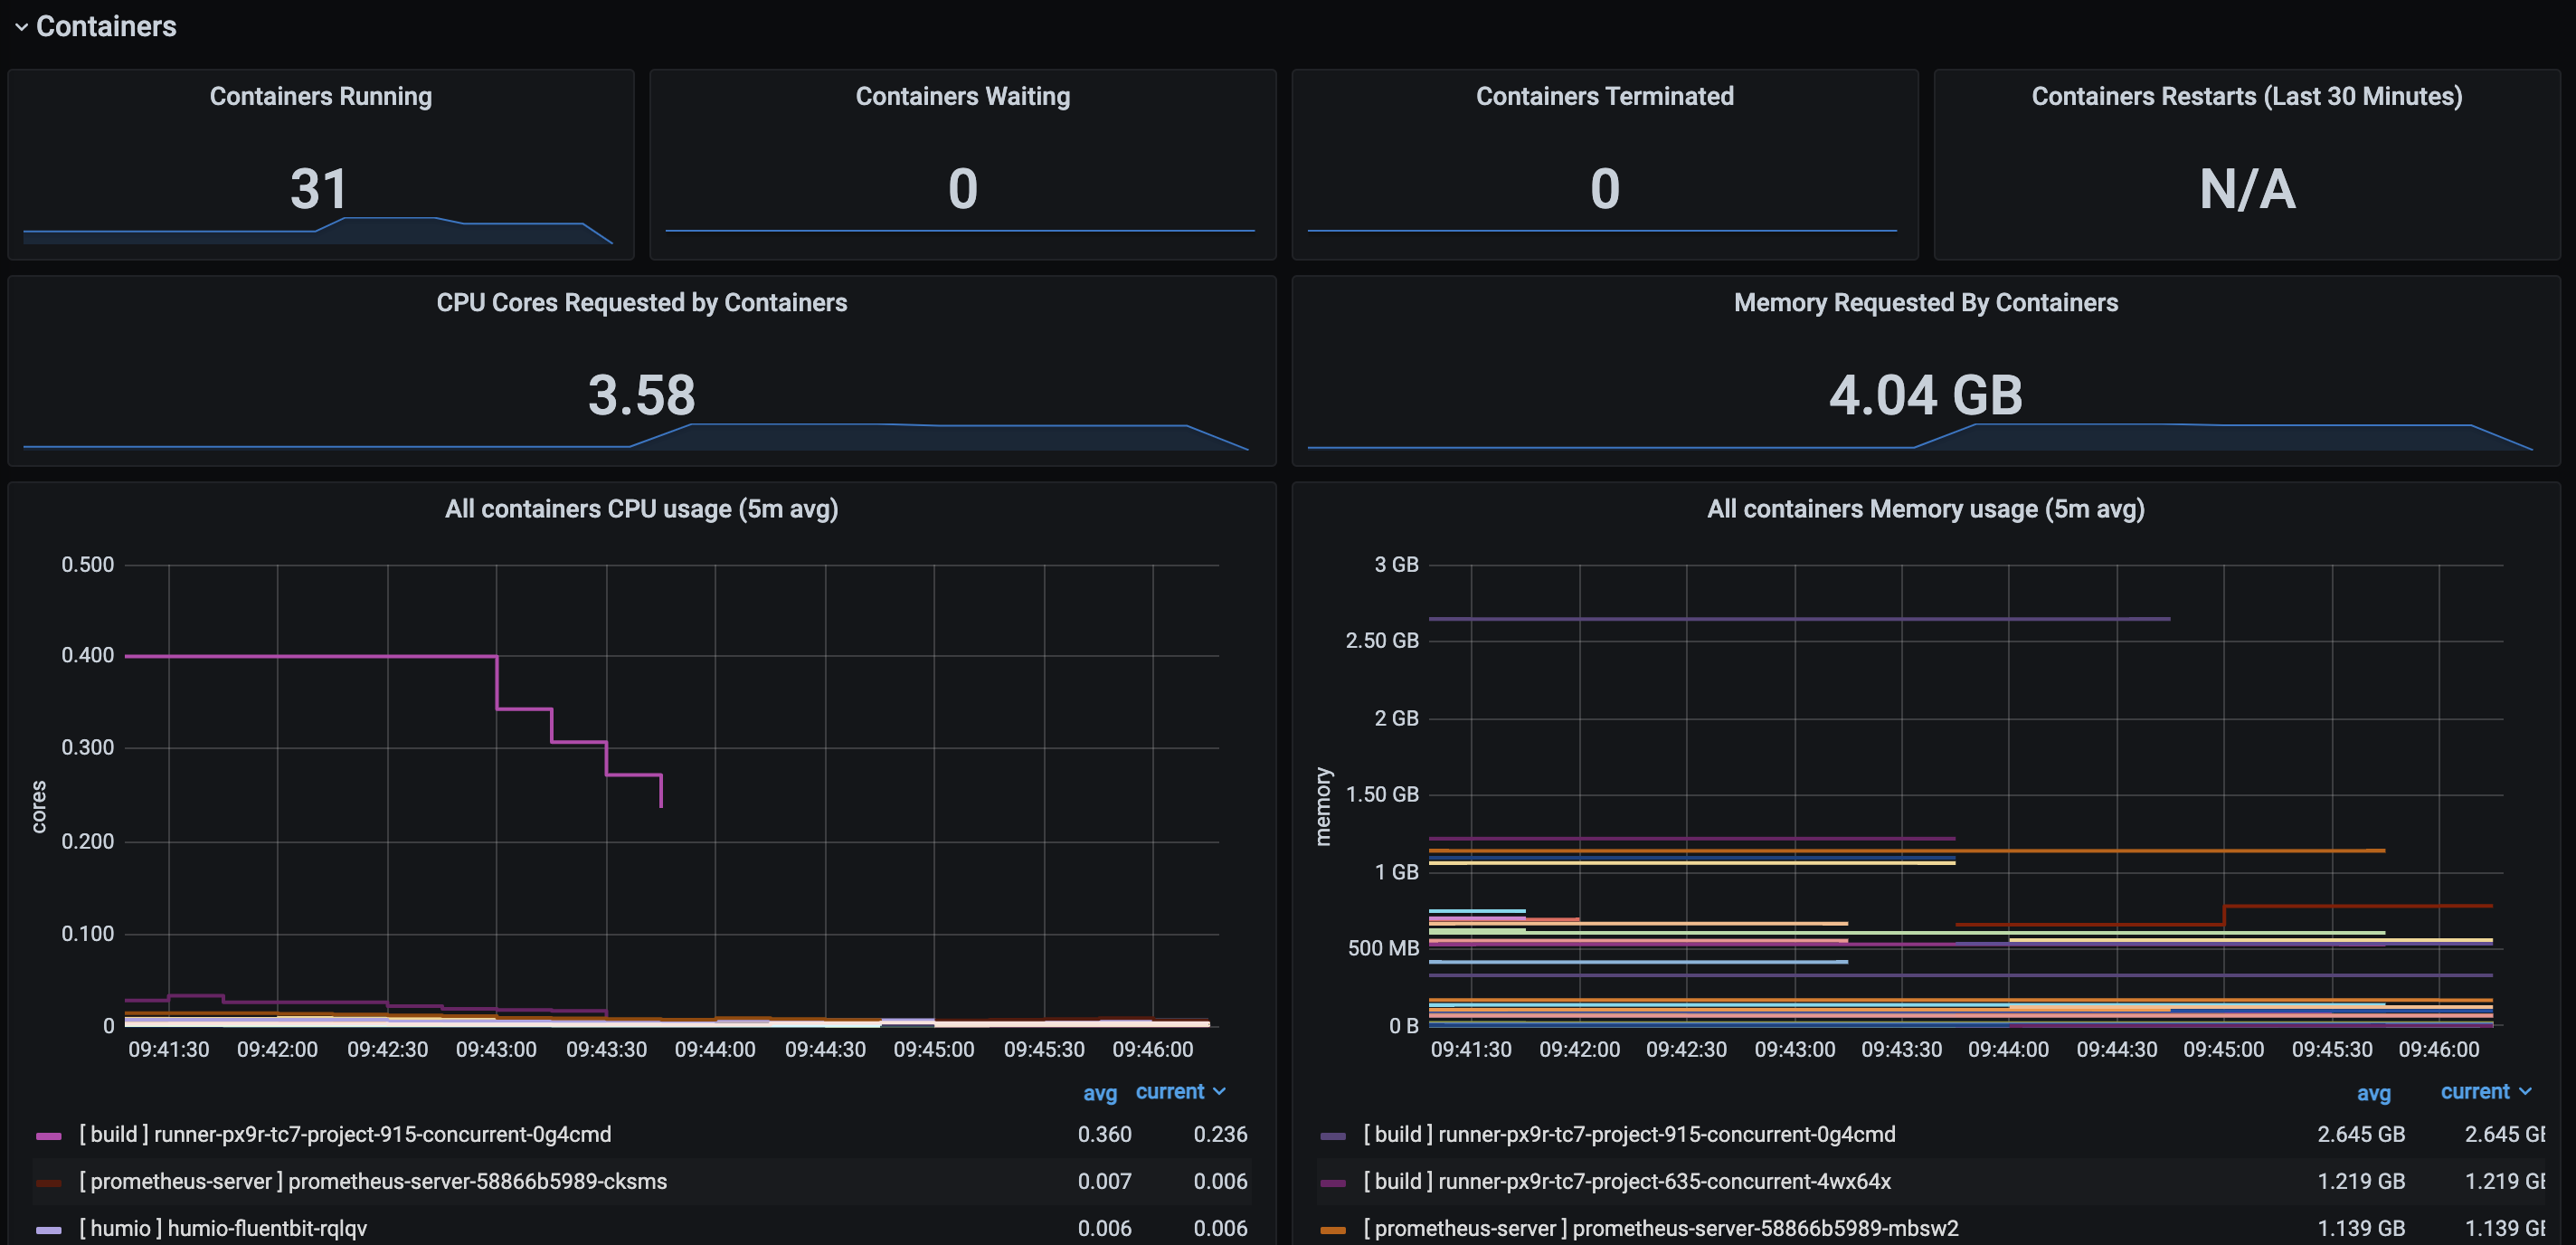
Kubernetes dashboard based on Prometheus datasources. This show multiple informations that can be filtered by time, namespaces, nodes and container names.
Data source config
Collector type:
Collector plugins:
Collector config:
Revisions
Upload an updated version of an exported dashboard.json file from Grafana
| Revision | Description | Created | |
|---|---|---|---|
| Download |
Kubernetes
Monitor your Kubernetes deployment with prebuilt visualizations that allow you to drill down from a high-level cluster overview to pod-specific details in minutes.
Learn more