Multi Cluster Kubernetes Deployment Statefulset Daemonset metrics
Monitors Kubernetes deployments in cluster using Prometheus. Shows overall cluster CPU / Memory of deployments, replicas in each deployment. Uses Kube state metrics and cAdvisor metrics (741)
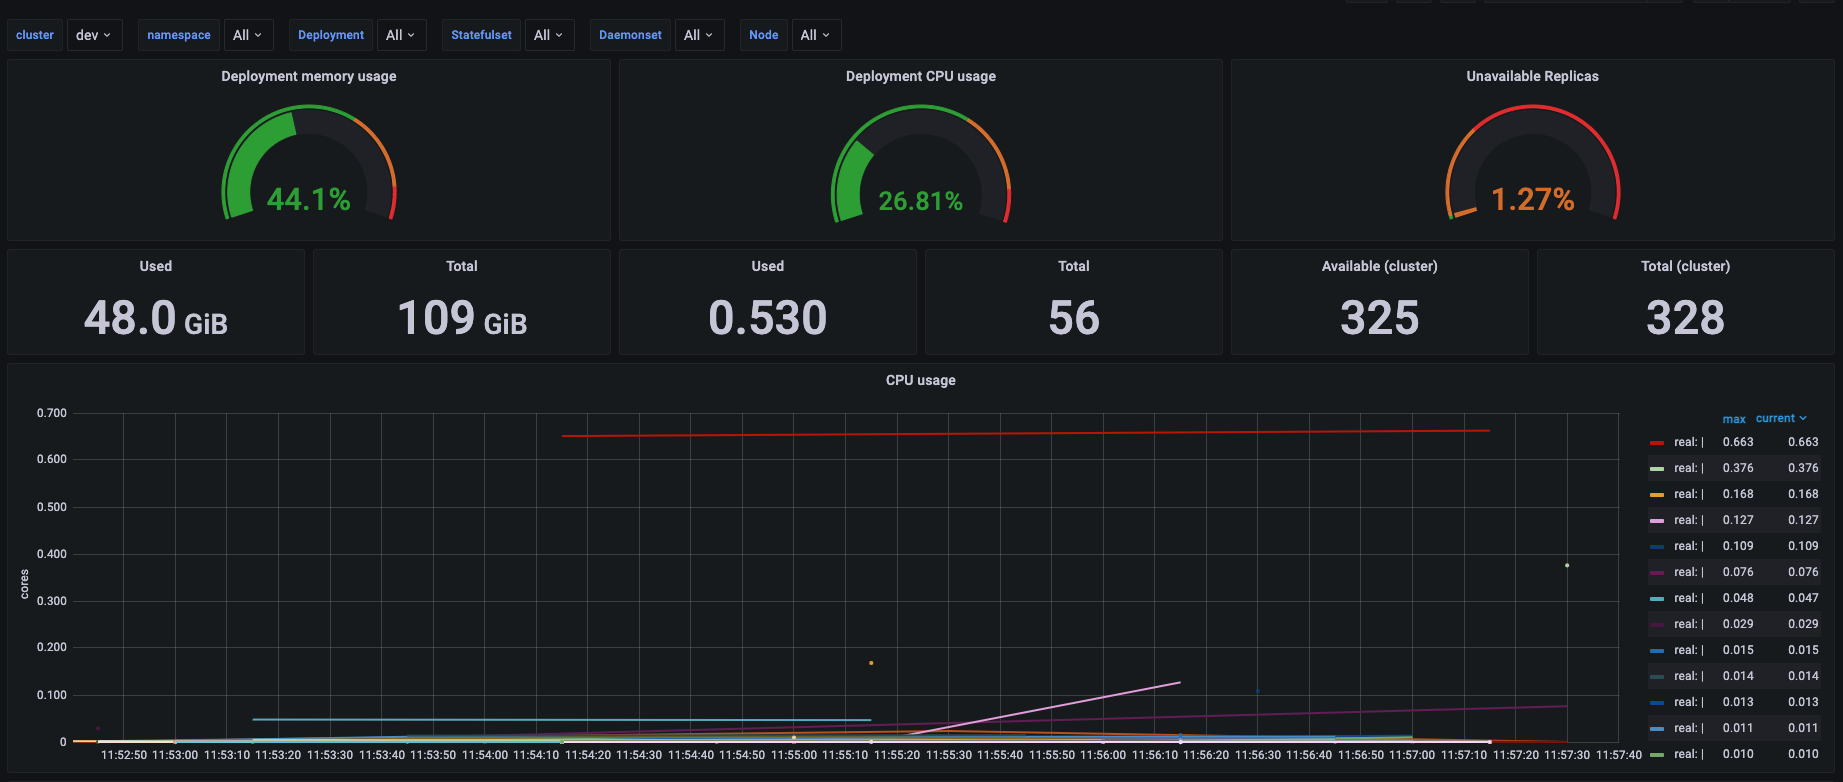
The Multi Cluster Kubernetes Deployment Statefulset Daemonset metrics dashboard uses the prometheus data source to create a Grafana dashboard with the gauge, graph and stat panels.
Data source config
Collector type:
Collector plugins:
Collector config:
Revisions
Upload an updated version of an exported dashboard.json file from Grafana
| Revision | Description | Created | |
|---|---|---|---|
| Download |
Kubernetes
Monitor your Kubernetes deployment with prebuilt visualizations that allow you to drill down from a high-level cluster overview to pod-specific details in minutes.
Learn more