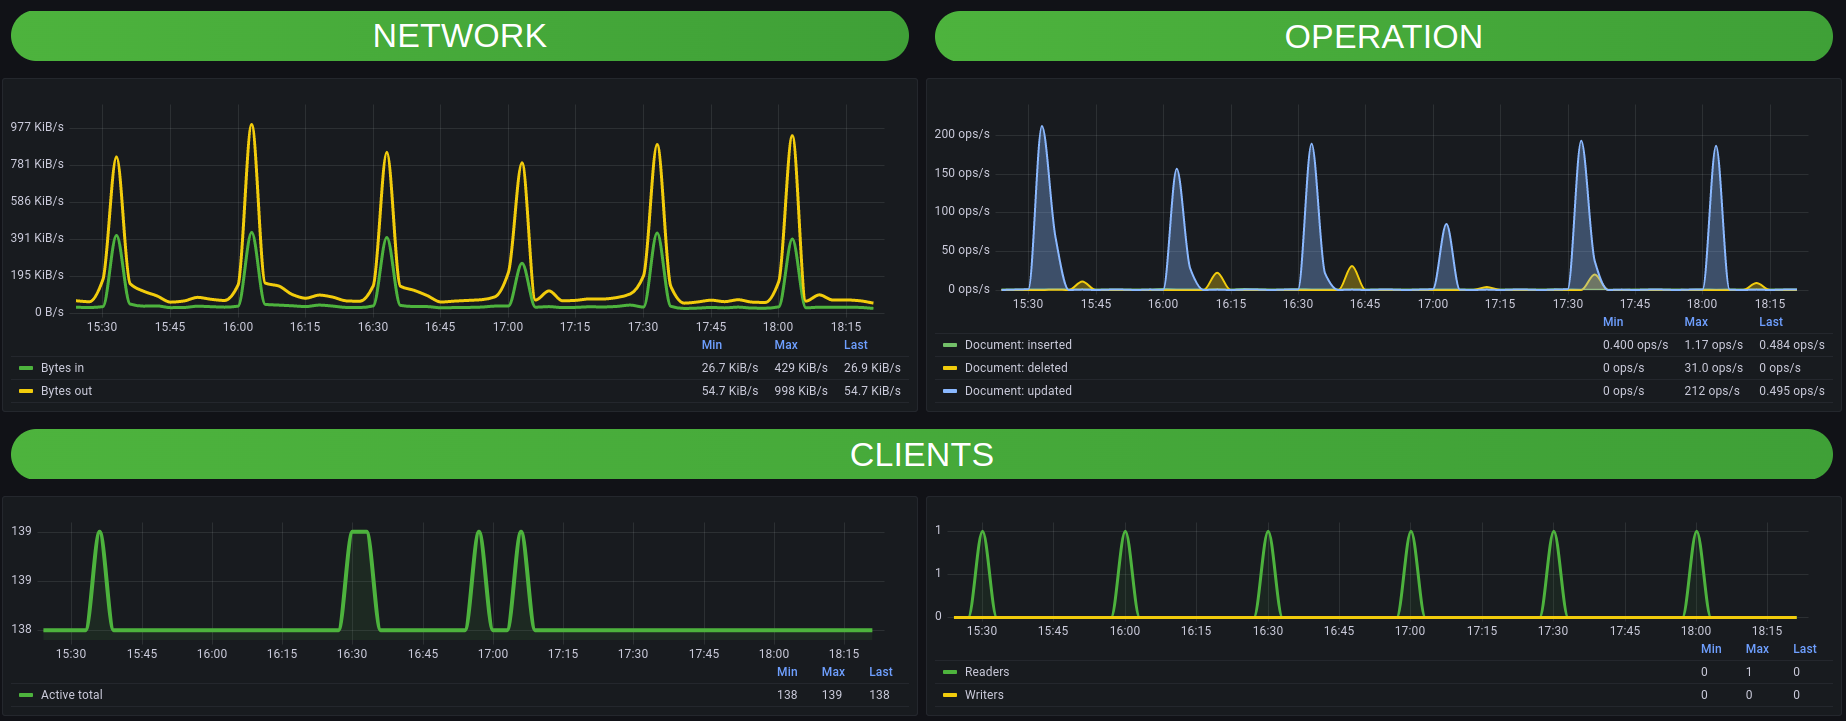
MongoDB Server
Example of MongoDB database dashboard monitored through Zabbix
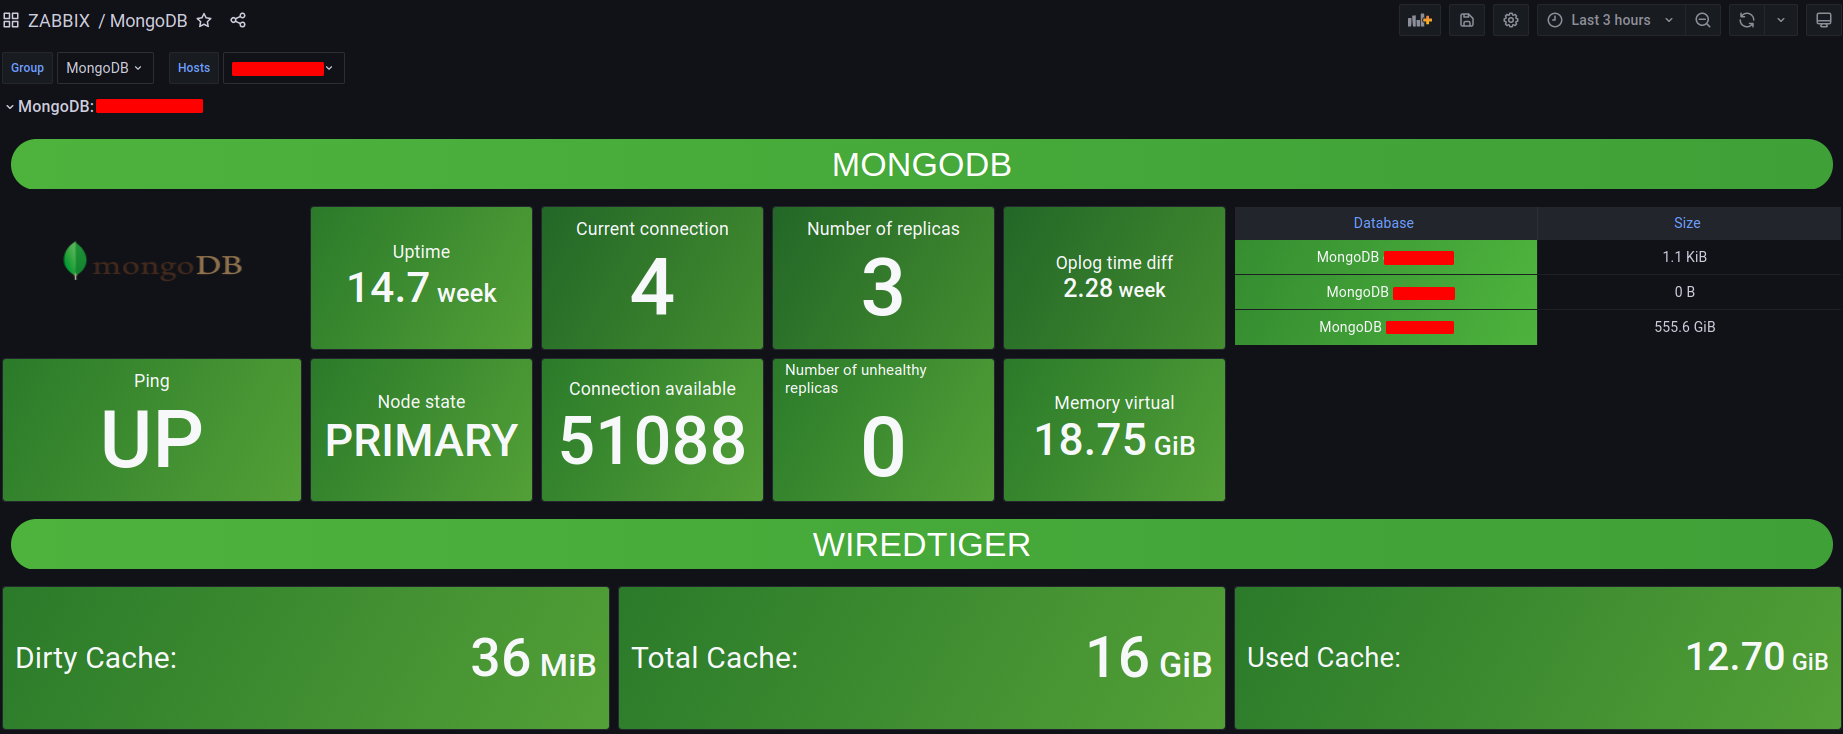
- Zabbix server 6.0 LTS
- MongoDB node by Zabbix agent 2
Data source config
Collector type:
Collector plugins:
Collector config:
Revisions
Upload an updated version of an exported dashboard.json file from Grafana
| Revision | Description | Created | |
|---|---|---|---|
| Download |
MongoDB
Easily monitor MongoDB, a general purpose, document-based, distributed database, with Grafana Cloud's out-of-the-box monitoring solution.
Learn more