MySQL Semi-Sync Summary (Designed for PMM)
This dashboard displays metrics from the MySQL Replication Semisynchronous feature available since 5.6.
This dashboard displays metrics from the MySQL Replication Semisynchronous feature available since 5.6. Designed for https://www.percona.com/software/database-tools/percona-monitoring-and-management
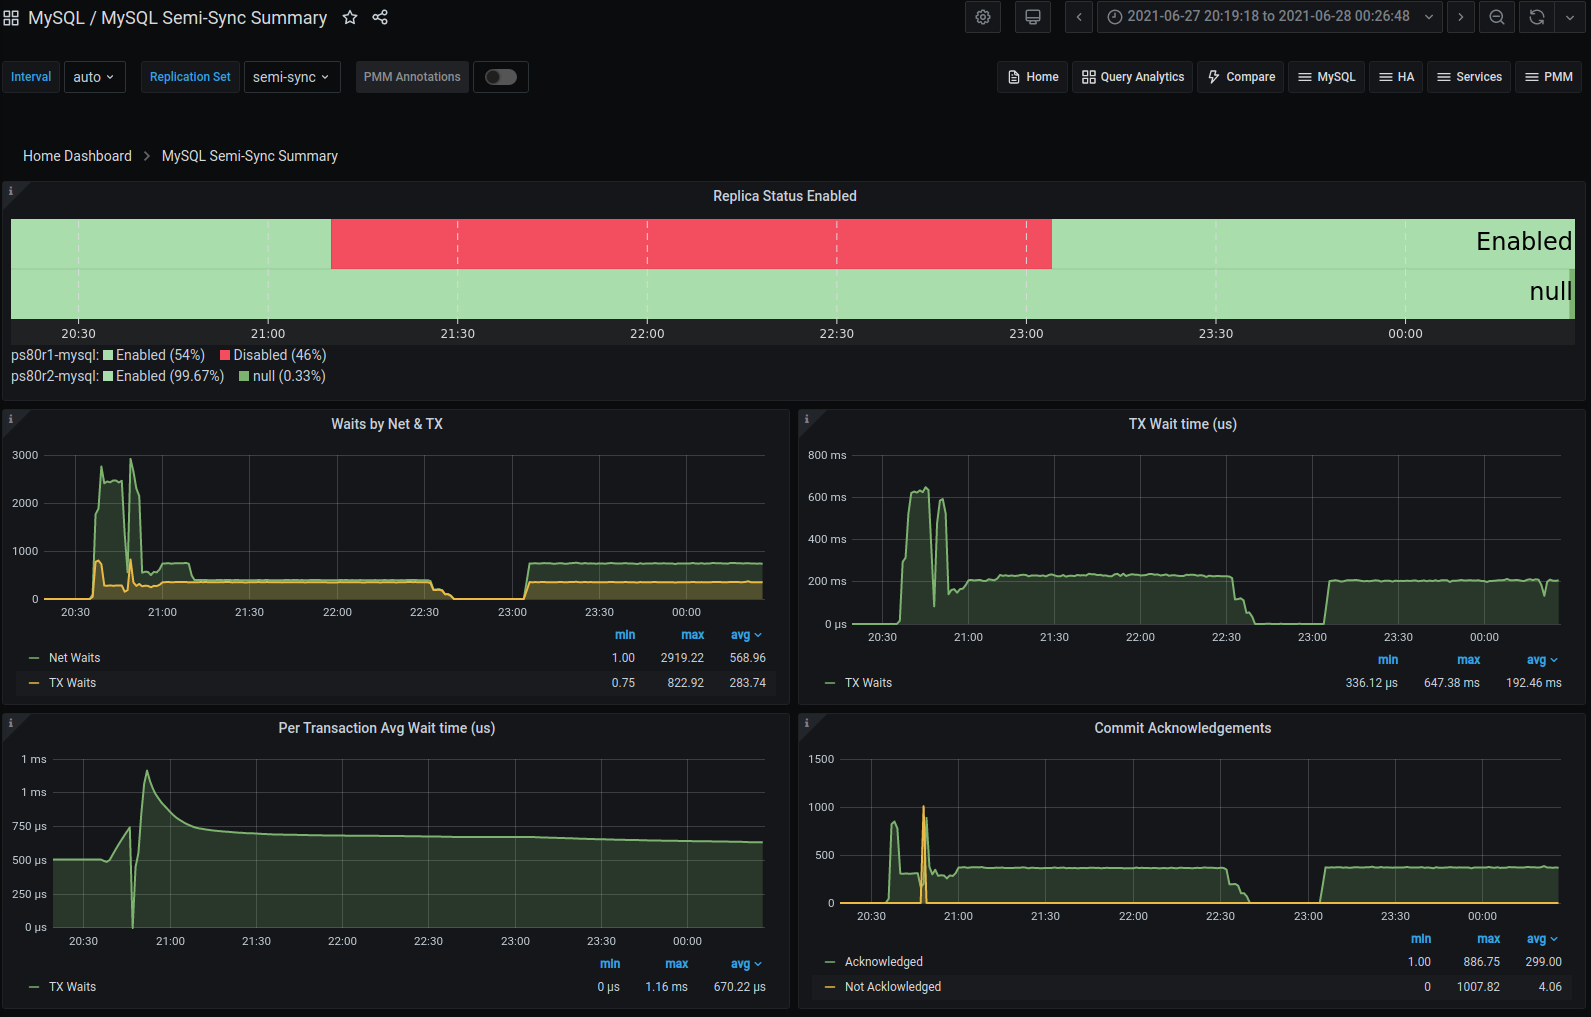
This dashboard leverages data collected by the mysqld_exporter and takes advantage of the metric series named mysql_global_status_rpl_semi_sync_* . The five graphs are:
- Replica semi-sync status - enabled or not
- Waits by type, on Network or on Transactions
- How much total time was spent waiting on Transactions - what's my penalty due to writes slowing down
- How much average time was spent waiting per transaction Commit acknowledgments - what's my replication throughput
Data source config
Collector type:
Collector plugins:
Collector config:
Revisions
Upload an updated version of an exported dashboard.json file from Grafana
| Revision | Description | Created | |
|---|---|---|---|
| Download |
MySQL
Monitor MySQL with Grafana. Easily monitor your MySQL deployment with Grafana Cloud's out-of-the-box monitoring solution.
Learn more