Redis Clusters via redis_exporter 3.0
Prometheus dashboard for Redis servers
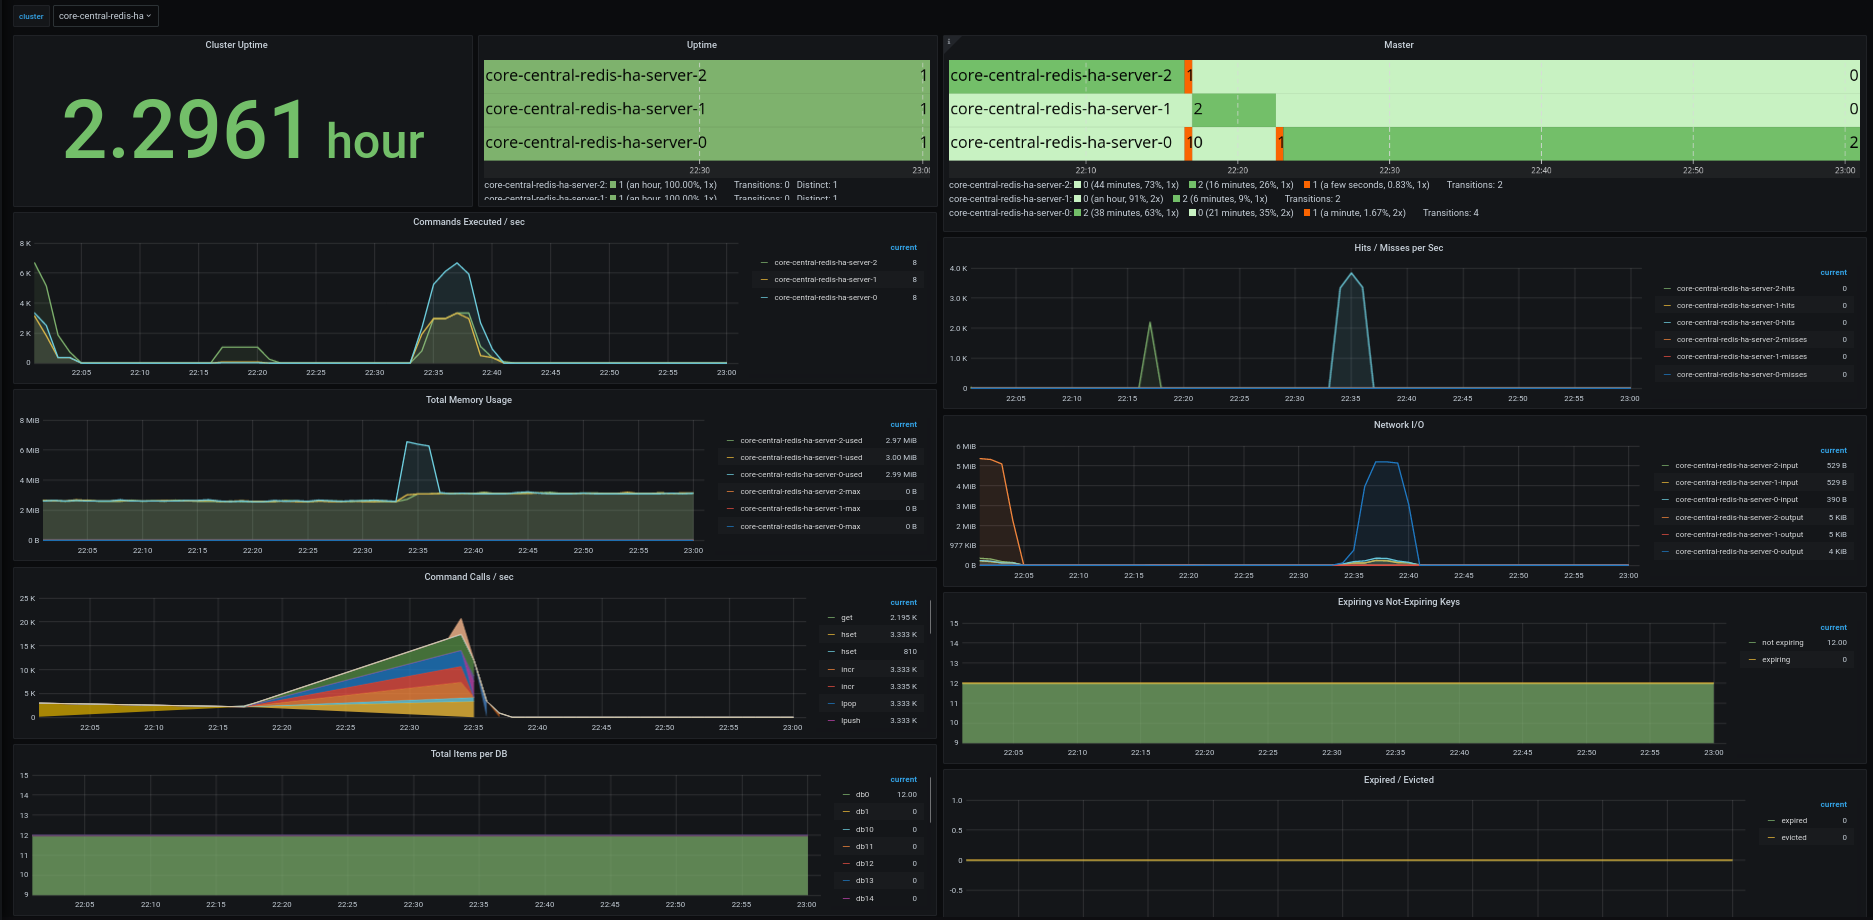
Grafana Dashboard for Prometheus/Thanos metrics populated via the redis_exporter. Redis clusters in the screenshot were installed via the redis-ha chart (https://github.com/DandyDeveloper/charts)
Improvement over https://grafana.com/grafana/dashboards/763 and https://grafana.com/grafana/dashboards/4074 by using name of the redis cluster instead (via the job label on prometheus)
Data source config
Collector type:
Collector plugins:
Collector config:
Revisions
Upload an updated version of an exported dashboard.json file from Grafana
| Revision | Description | Created | |
|---|---|---|---|
| Download |
Redis
Monitor Redis with Grafana. Easily monitor your Redis deployment with Grafana Cloud's out-of-the-box monitoring solution.
Learn more