Slurm Cgroups
Metrics collected by the cgroups_exporter.
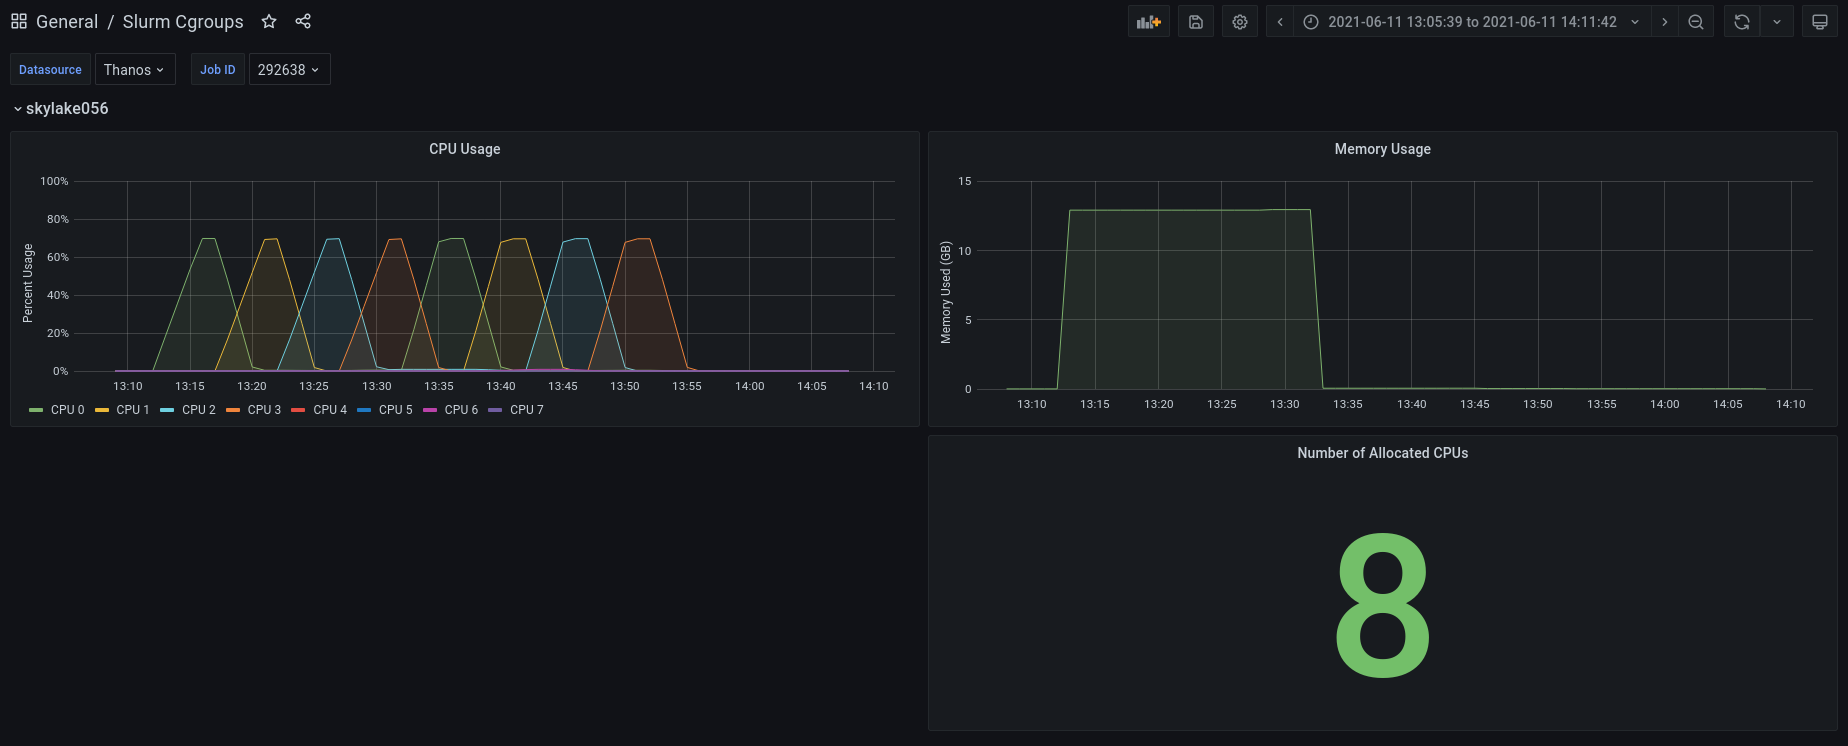
This dashboard visualizes data collected by the Prometheus cgroups_exporter running in Slurm mode on an High Performance Computing (HPC) cluster that utilizes the Slurm scheduler configured with TaskPlugin=task/cgroup. The dashboard visualizes per-node metrics at the job-level for jobs that run across multiple nodes in a cluster.
Metrics include:
- Per-CPU usage: When there are multiple jobs running on a single node, this dashboard visualizes only CPUs utilized by a given job on that node.
- Total CPU usage: Shows the total CPU utilization for only those CPUs scheduled to your job on each node.
- Memory usage: Likewise, this dashboard visualizes the memory utilized by only a given job, even if multiple jobs ran on the same node and utilized memory.
Data source config
Collector type:
Collector plugins:
Collector config:
Revisions
Upload an updated version of an exported dashboard.json file from Grafana
| Revision | Description | Created | |
|---|---|---|---|
| Download |