CoreDNS (Cluster and Node-Local)
A dashboard for the CoreDNS DNS server metrics 1.7.0+ and with a panel of total requests by POD to compare before/after impact on a cluster's kube-dns PODs after deploying node-local-dns. Based on the CoreDNS dashboards by ejkinger and buhay.
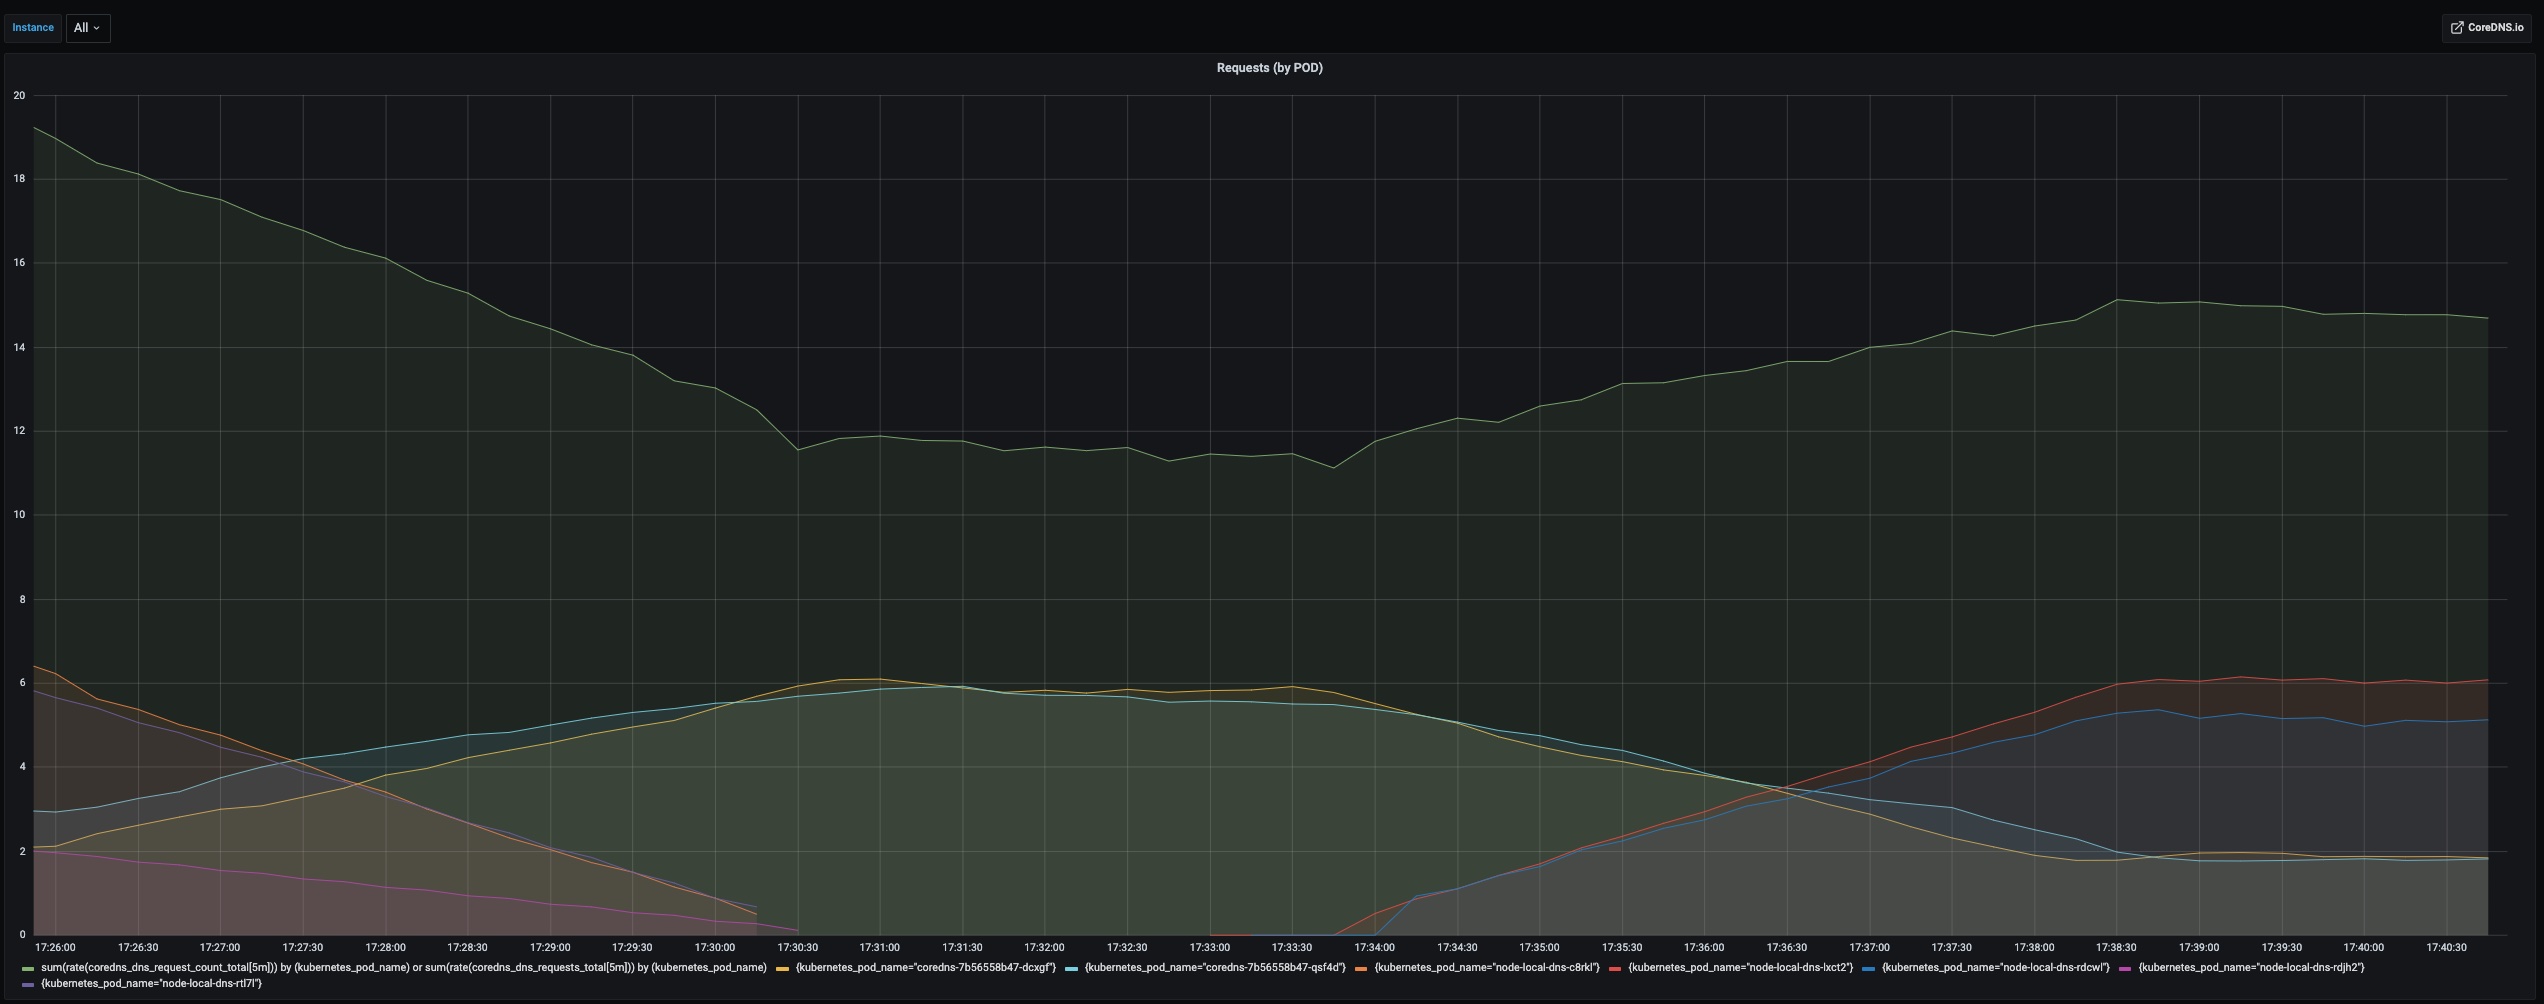
The CoreDNS (Cluster and Node-Local) dashboard uses the prometheus data source to create a Grafana dashboard with the graph panel.
Data source config
Collector type:
Collector plugins:
Collector config:
Revisions
Upload an updated version of an exported dashboard.json file from Grafana
| Revision | Description | Created | |
|---|---|---|---|
| Download |
CoreDNS
Monitor CoreDNS with Grafana. Easily keep tabs on your DNS server with Grafana Cloud's out-of-the-box monitoring solution.
Learn more