UPS Dashboard
Panel for nobreak with the components output current, output frequency, output load, output_voltage input frequency and battery autonomy.
Dashboard for nobreaks (UPS). It's contains the following metrics:
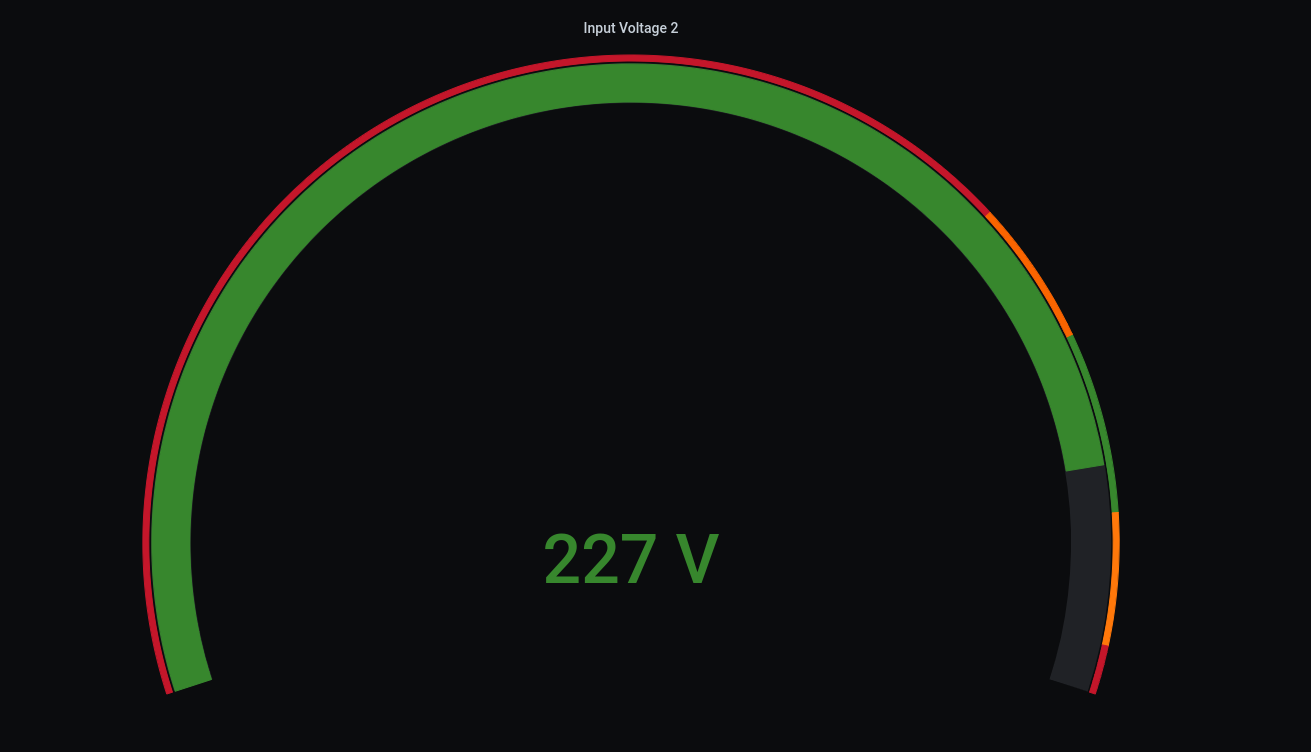
- Gauge graphs for: input voltages 1, 2, 3, outputs voltages 1, 2, 3 and UPS Battery Capacity
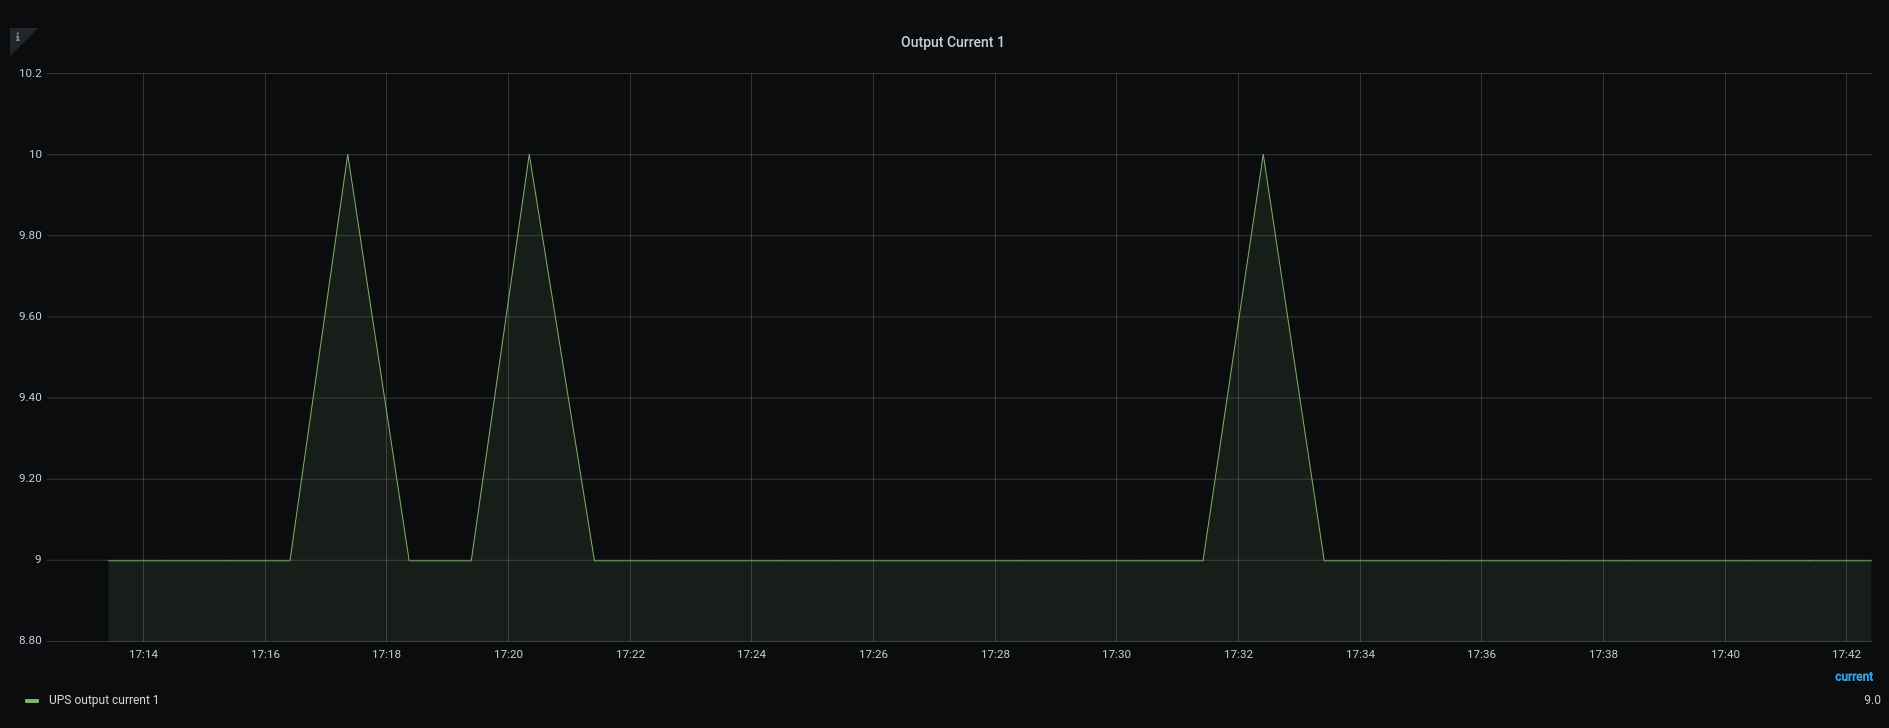
- Graph for: outputcurrent 1, 2, 3
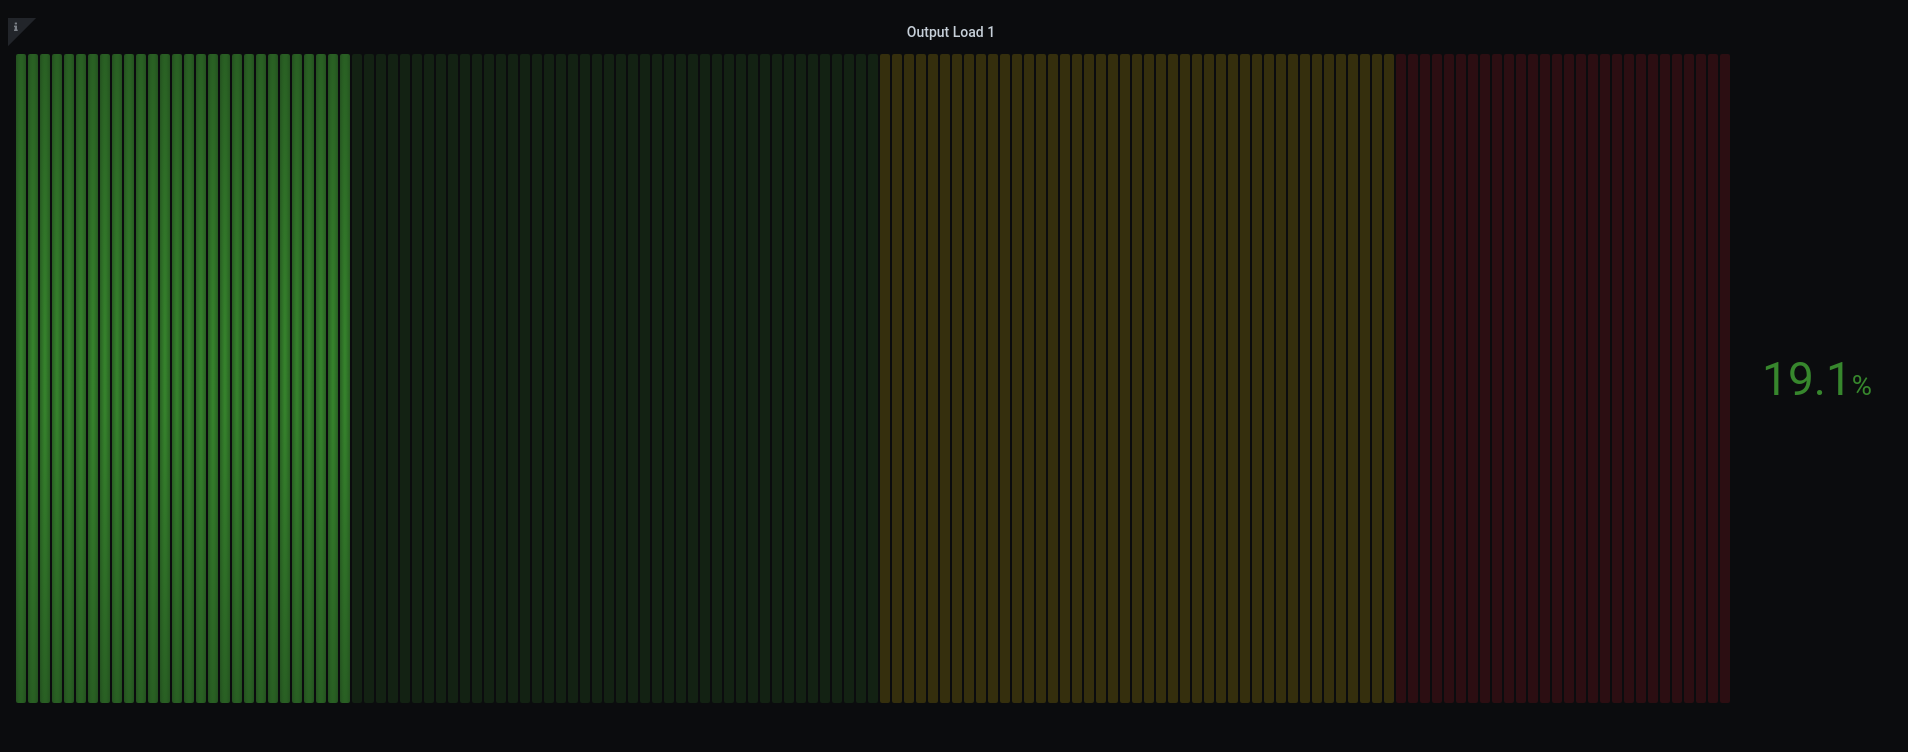
- Bar gauge for: outputs loads 1, 2, 3
- Stat for: Input and output frequency and Battery Autonomy
- Text: for destak the name of your equipament.
Important
It's available the zabbix template what is applicable for this dashboard. Check in: https://share.zabbix.com/power-ups/template-ups-abb Name of template. Template UPS ABB.
After you import in your Zabbix this template and register the equipament. Back to grafana to fill the fields for loading correct this dashboard
Change data for the fields:
"group":{
    "filter":"Zabbix/groupHosts"
}
change for the name of your Zabbix Host group
"host":{
    "filter":"My-ups"
}
change for the name of your Zabbix host.
After changes your dashboard is done for use.
- Zabbix version template: 5.0.5
- Grafana version: 7.4.3
Data source config
Collector config:
Upload an updated version of an exported dashboard.json file from Grafana
| Revision | Description | Created | |
|---|---|---|---|
| Download |