Tableau de bord DSI
GLPI Dashboard Show somes informations on tickets
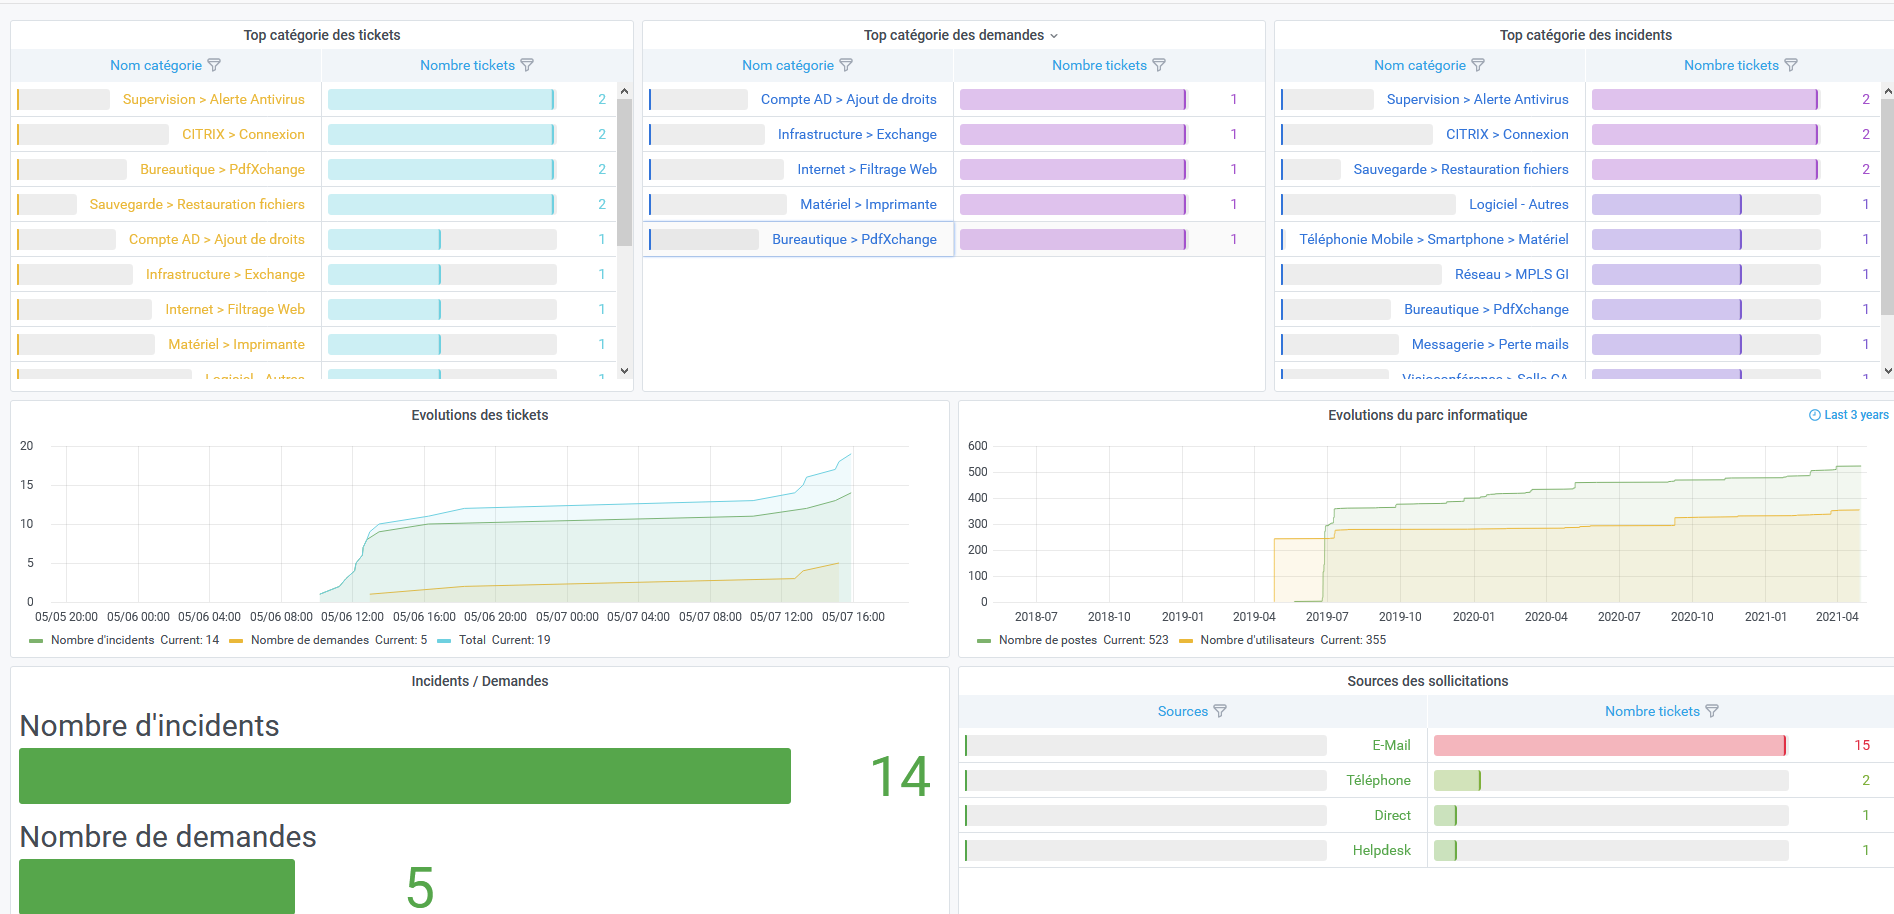
The Tableau de bord DSI dashboard uses the mysql data source to create a Grafana dashboard with the bargauge, graph, table and timeseries panels.
Data source config
Collector type:
Collector plugins:
Collector config:
Revisions
Upload an updated version of an exported dashboard.json file from Grafana
| Revision | Description | Created | |
|---|---|---|---|
| Download |