Elasticsearch Exporter Quickstart and Dashboard
A quickstart to setup the Prometheus Elasticsearch Exporter with preconfigured dashboards, alerting rules, and recording rules.
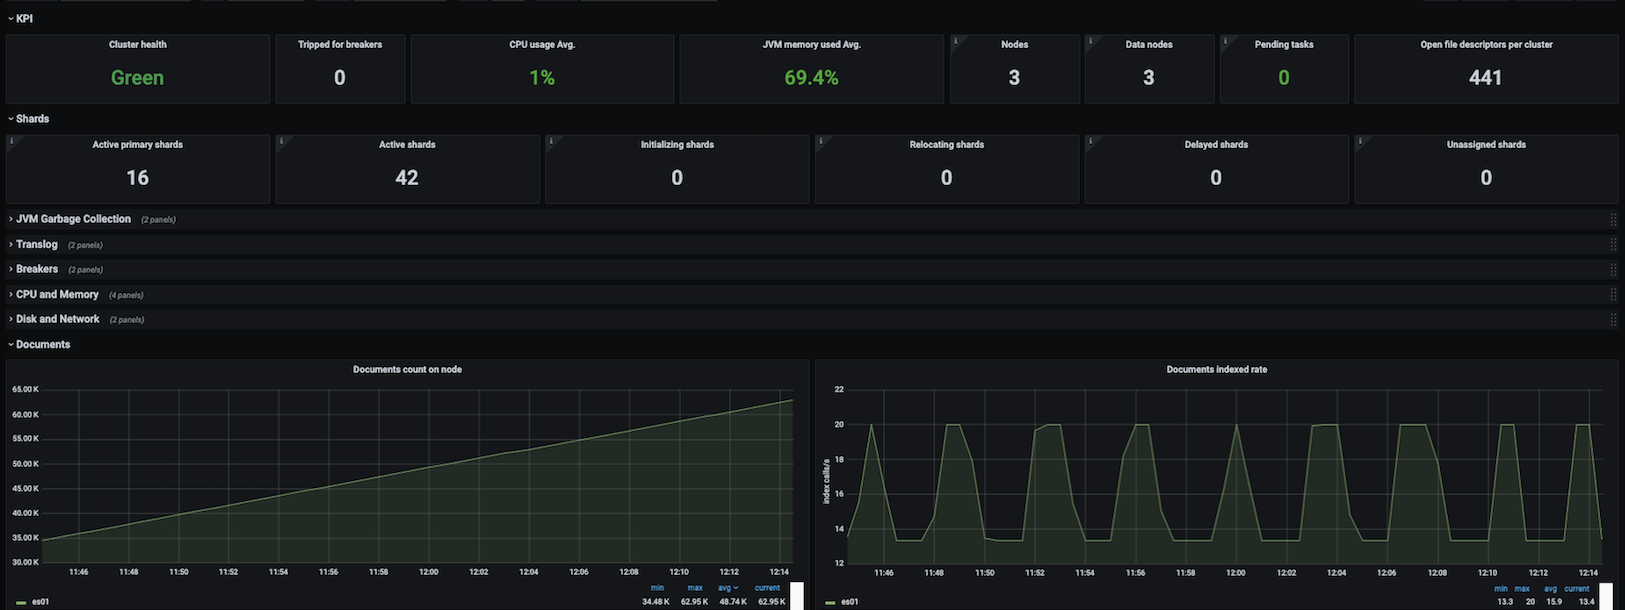
To use this dashboard, please follow the Elasticsearch Exporter Quickstart. This quickstart helps you monitor your Elasticsearch cluster by setting up the Prometheus Elasticsearch exporter with preconfigured dashboards, alerting rules, and recording rules. This dashboard includes panels for the following metrics:
- Cluster Health
- CPU and Memory
- Disk Usage
- Network Usage
- Load Average
- JVM Memory Usage
- JVM Garbage Collection
- Tripped for Breakers
- Nodes
- Pending Tasks
- Open file descriptors per Cluster
- Active Primary Shards
- Active, Initializing, Relocating and Delayed Shards
- Translog
- Breakers
- Documents total count and size
- Documents count on node
- Documents indexed, deleted and merged rate
- Documents merged bytes
- Query, Indexing and Merging time
- Throttle time for index store
- Total Operations rate, time and stats
- Thread Pool
- Caches
- Segments
This dashboard was generated using the Elasticsearch Exporter mixin.
Data source config
Collector type:
Collector plugins:
Collector config:
Revisions
Upload an updated version of an exported dashboard.json file from Grafana
| Revision | Description | Created | |
|---|---|---|---|
| Download |
Elasticsearch
Easily monitor Elasticsearch, a distributed, multitenant full-text search engine, with Grafana Cloud's out-of-the-box monitoring solution.
Learn more