SolarEdge Modbus
Dashboard to monitor the SolarEdge modbus output (no battery and no meter)
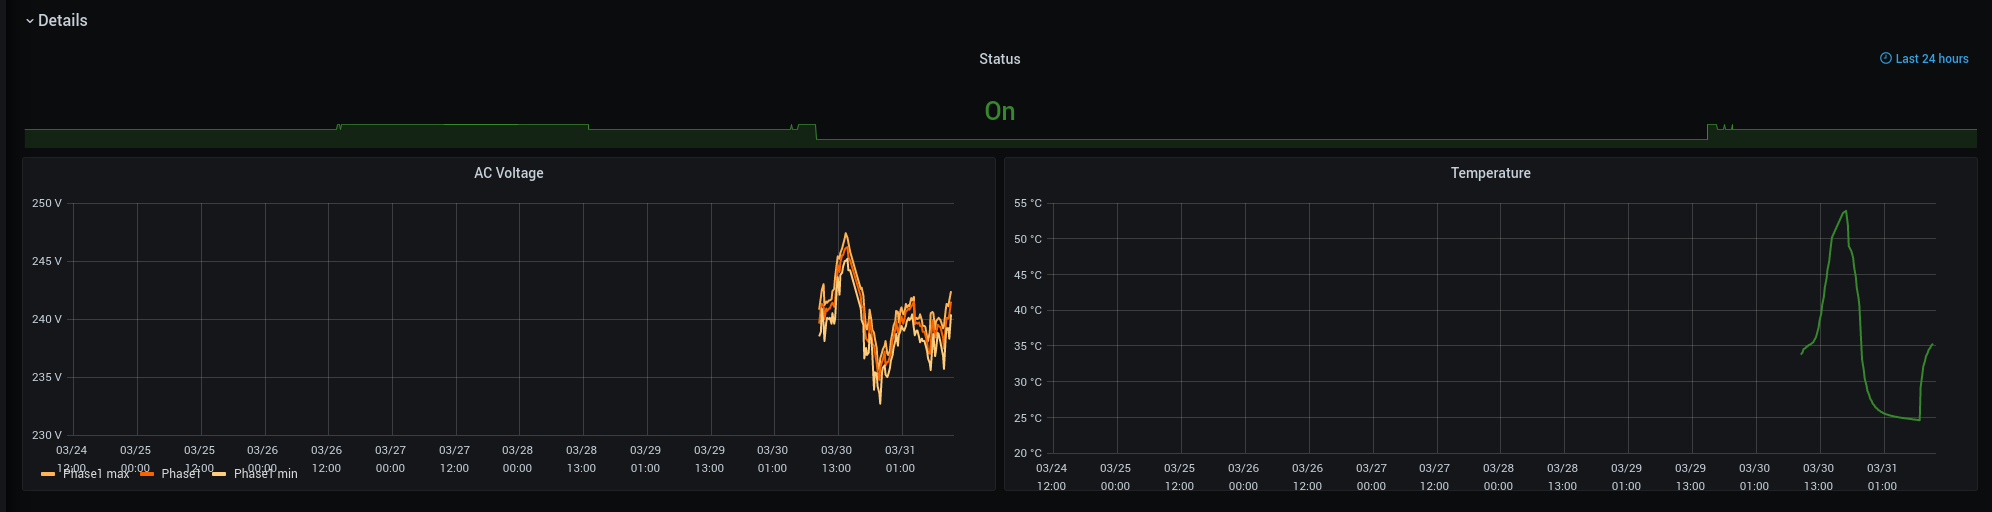
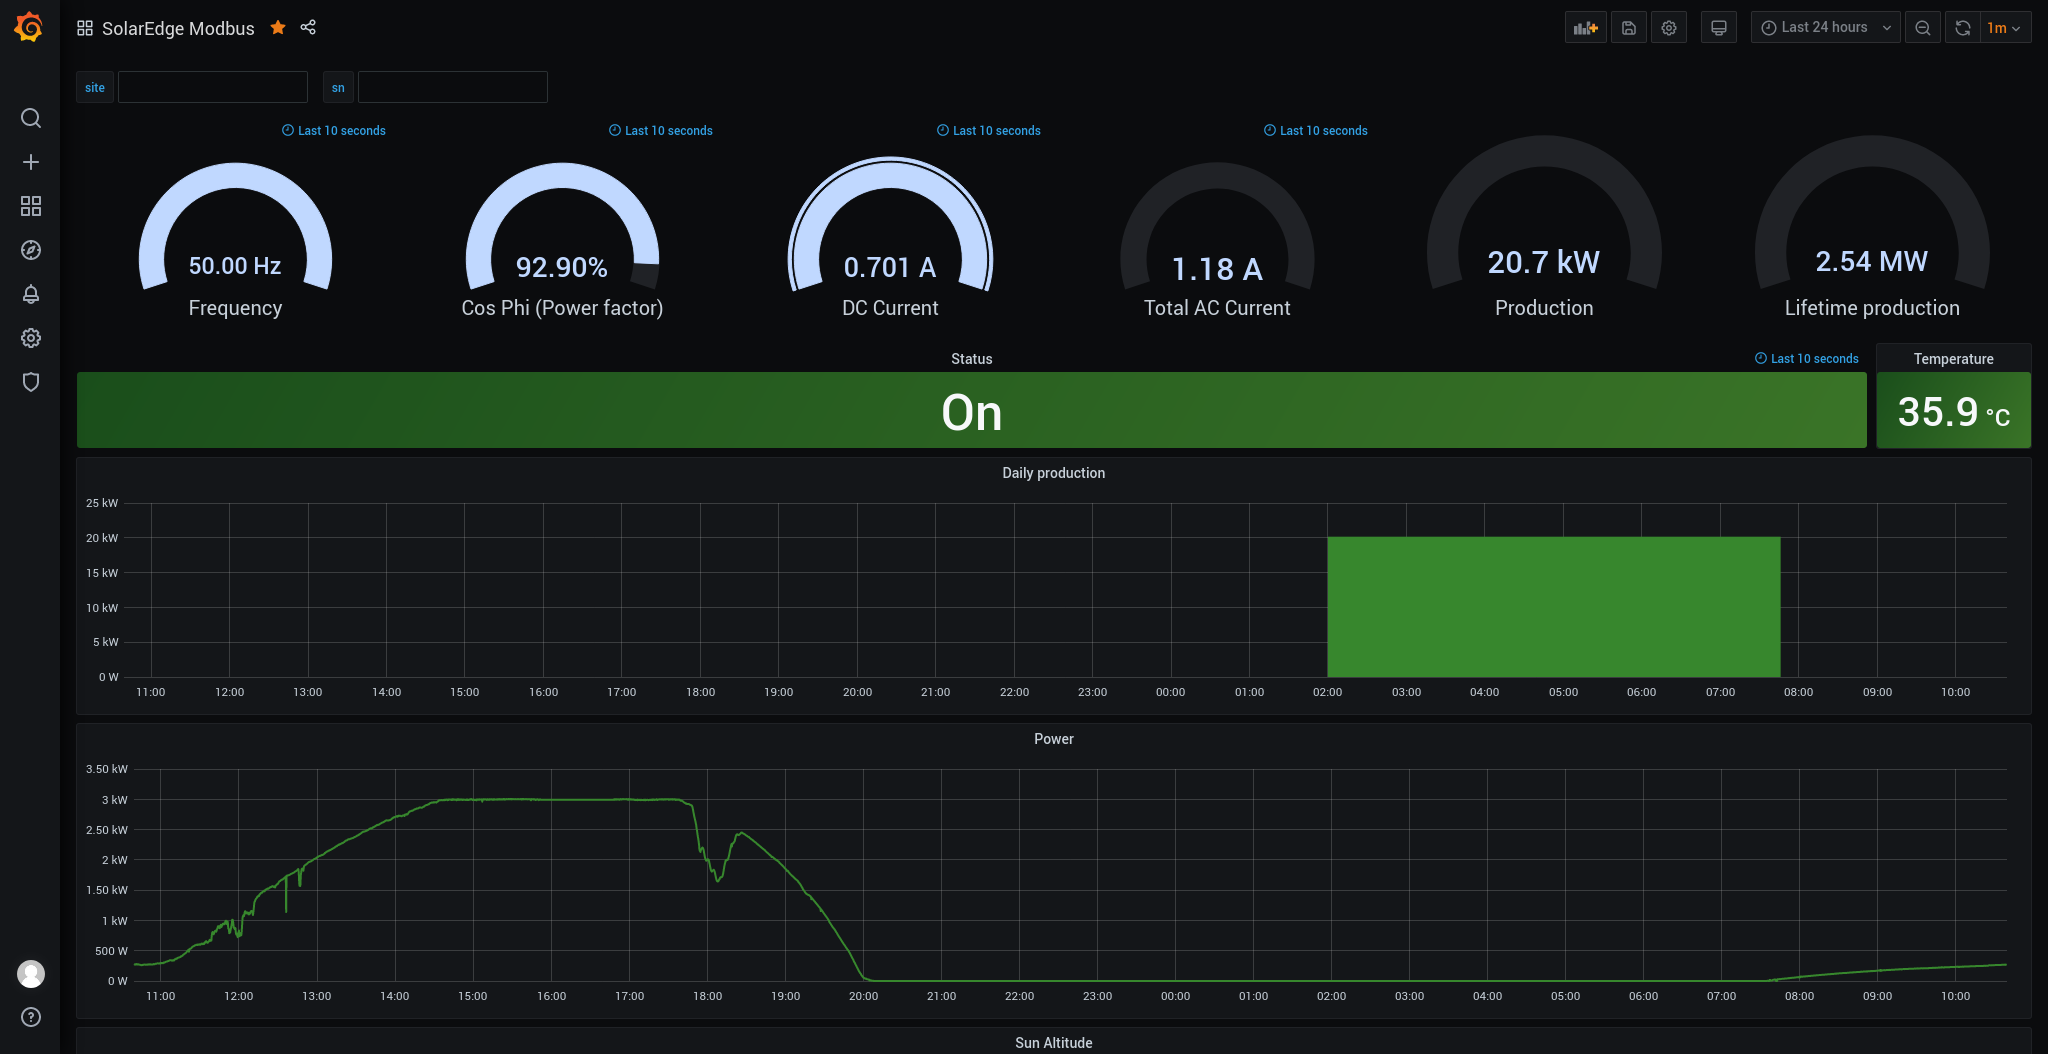
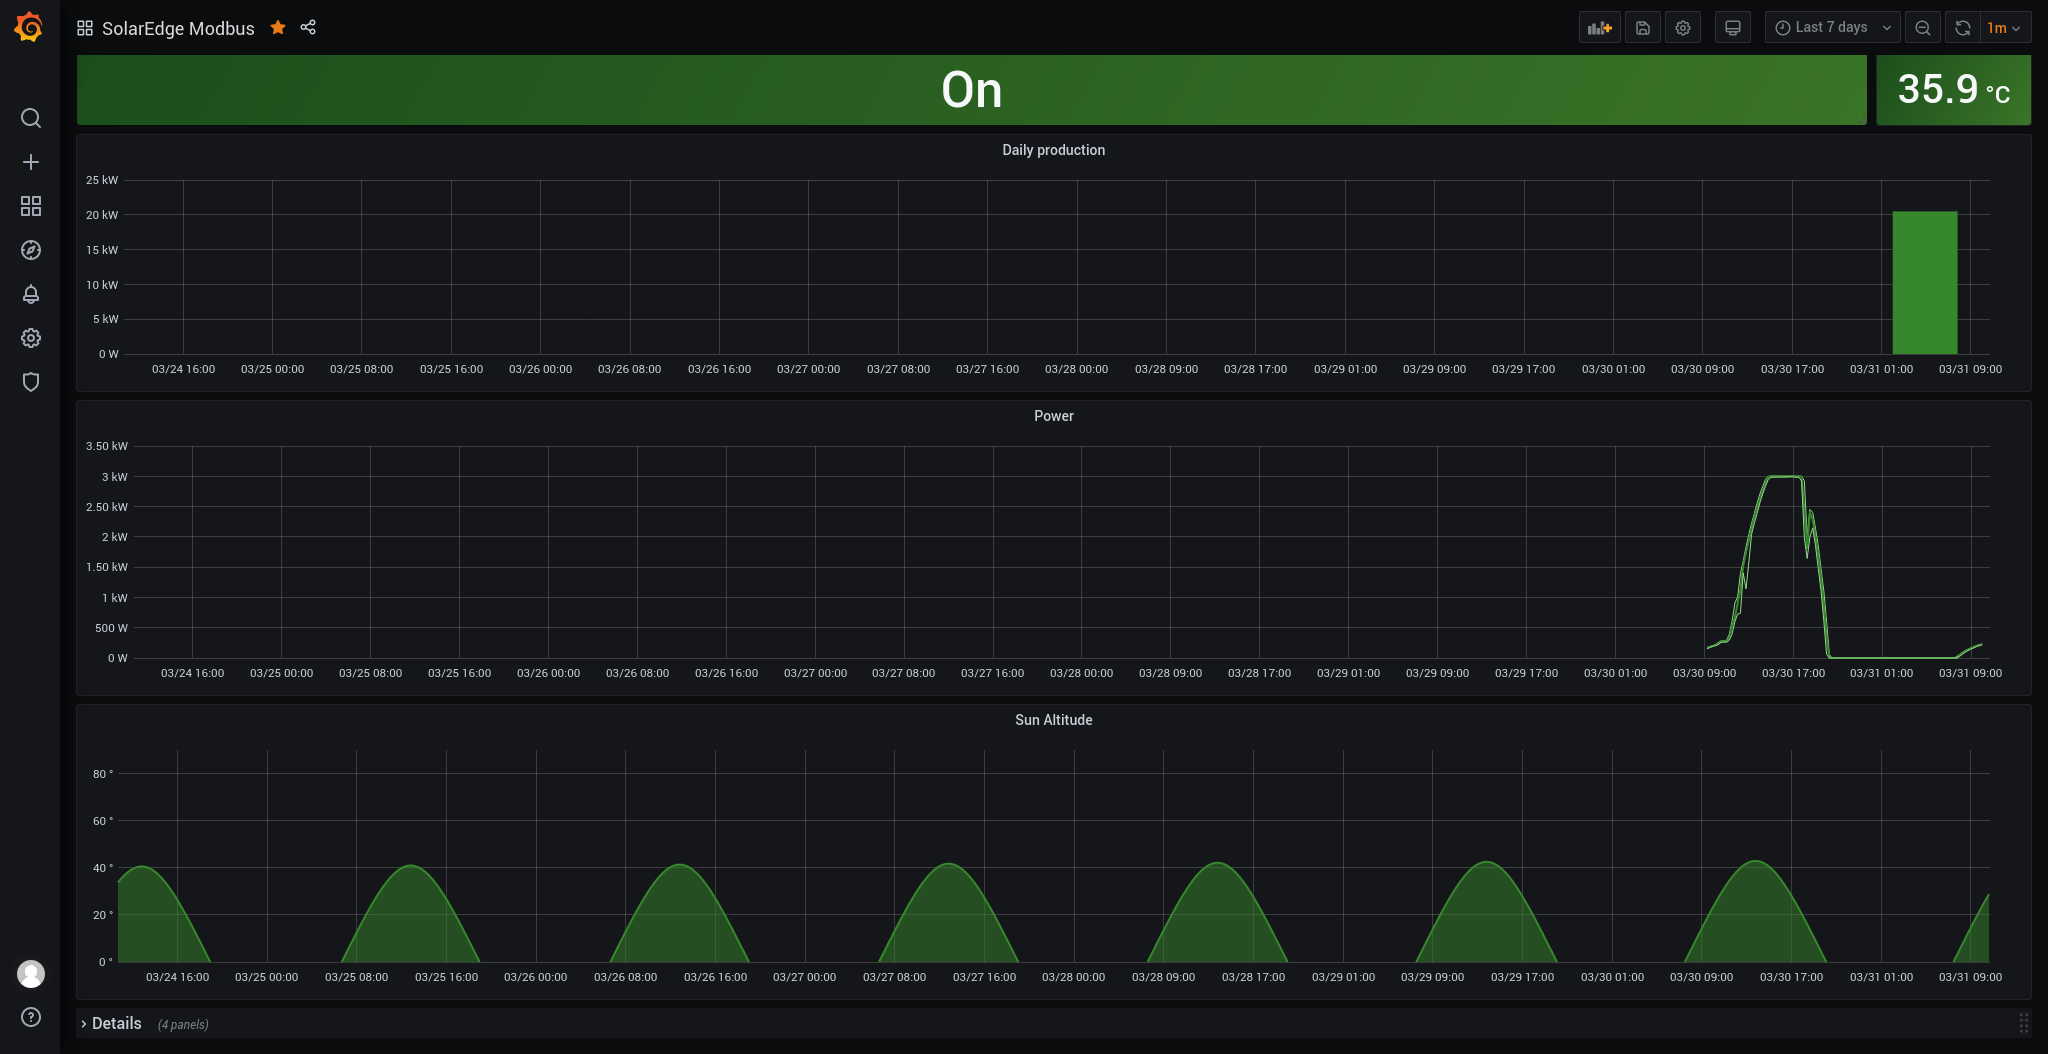
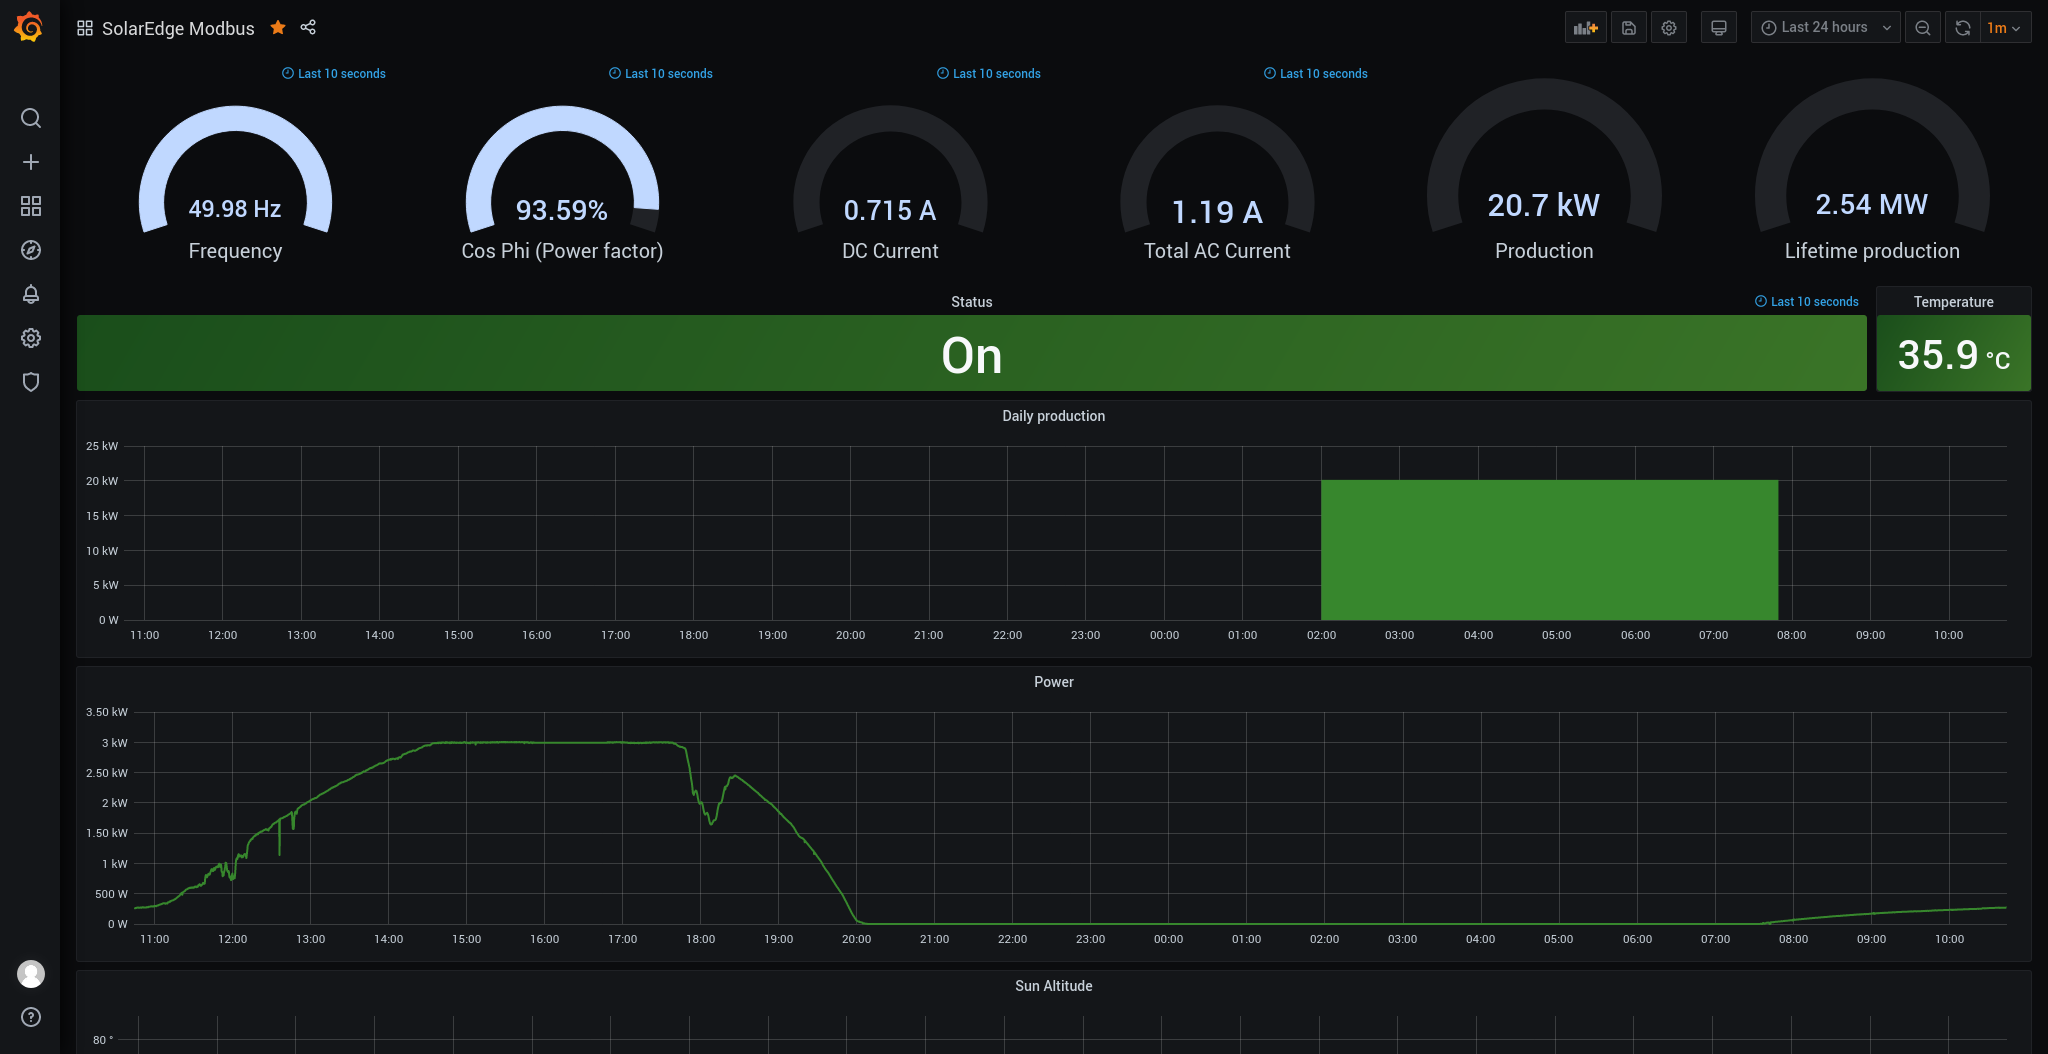
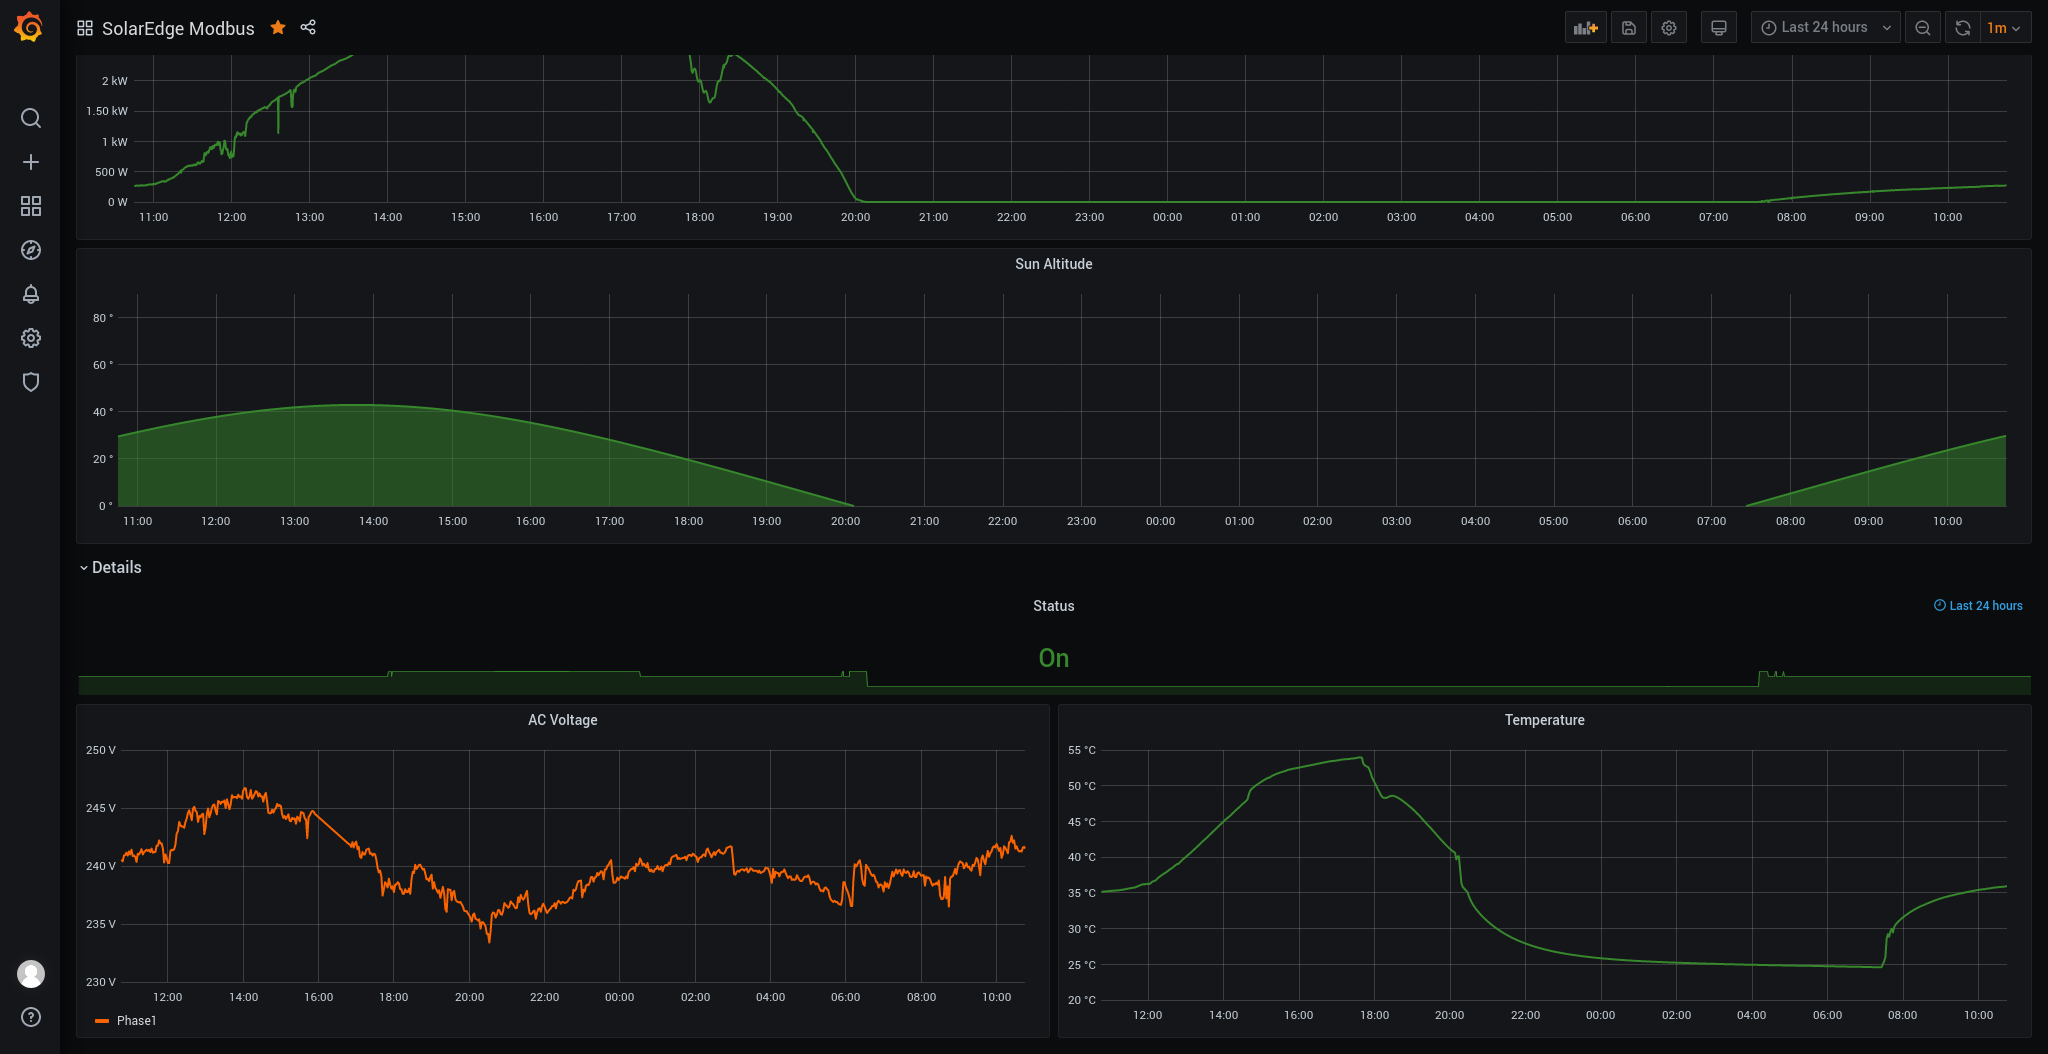
SolarEdge modbus data is gathered with Telegraf (inputs.modbus) and stored in InfluxDb after which it is visualized by Grafana; this dashboard. For more information on how to set everything up see this blogpost .
Data source config
Collector type:
Collector plugins:
Collector config:
Revisions
Upload an updated version of an exported dashboard.json file from Grafana
| Revision | Description | Created | |
|---|---|---|---|
| Download |