Solidfire Volume Detail
Solidfire Volume Detail powered by https://github.com/mjavier2k/solidfire-exporter
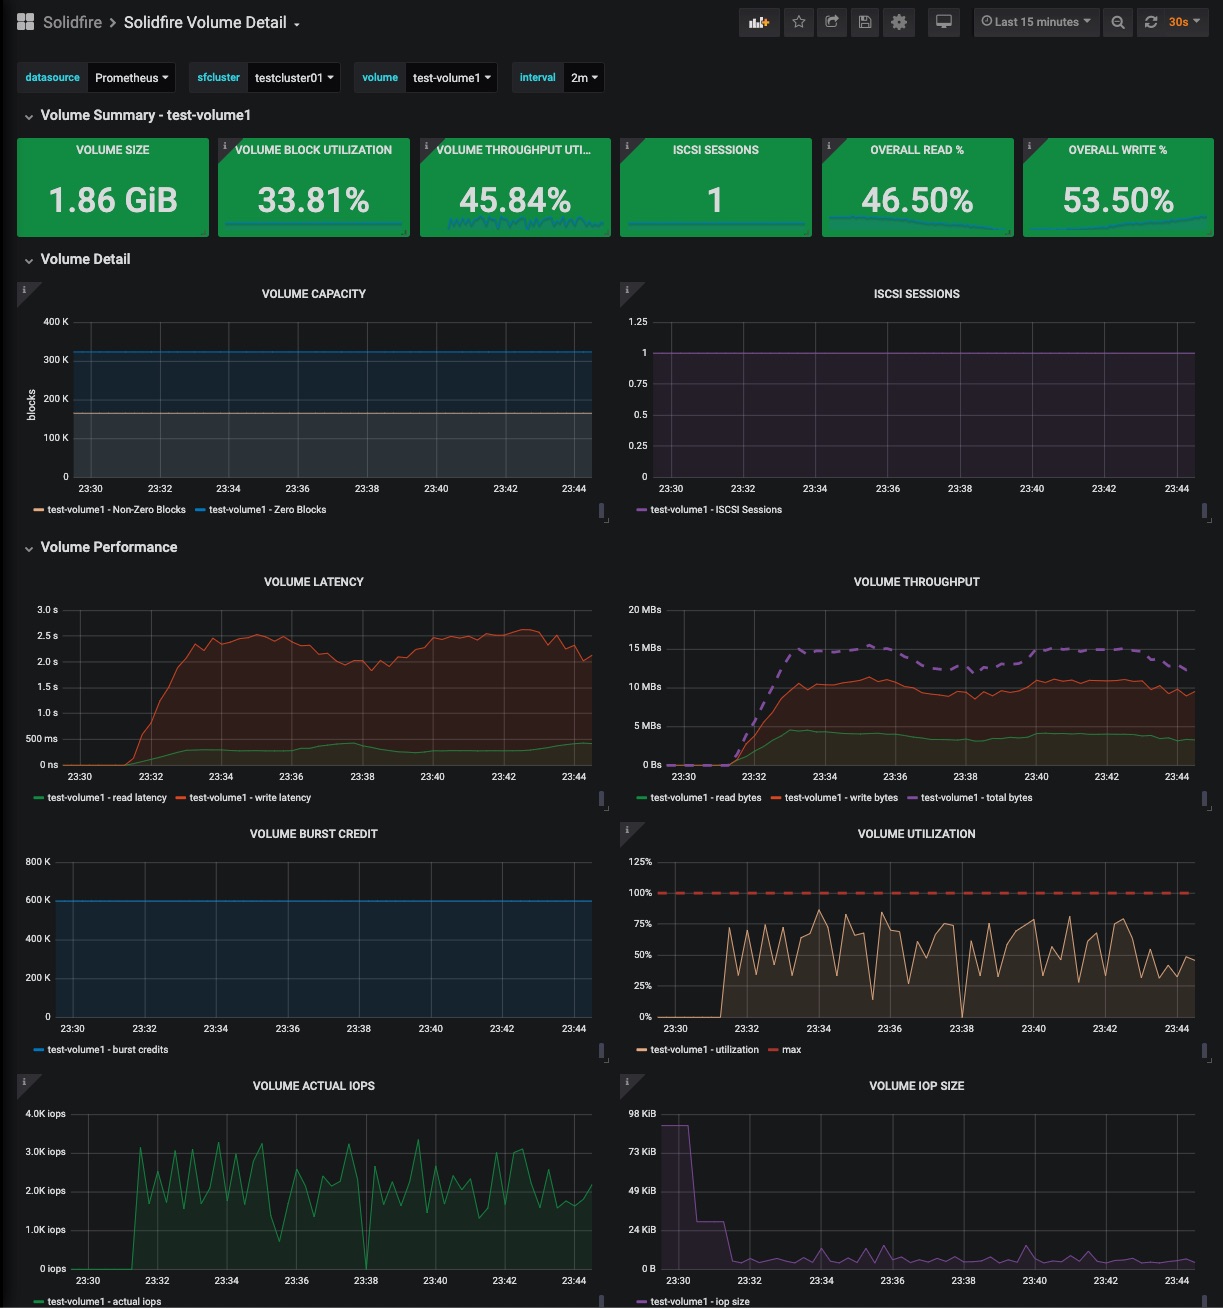
NetApp SolidFire Volume Detail
Since revision 2, this dashboard requires version v0.6.0 or higher of solidfire-exporter
The volume details dashboard contains information about:
- Volume size
- iSCSI Sessions
- Read/Write latency
- Read/Write Bytes
- Burst Credit
- Average IOP size
- Unaligned read/write bytes
- Throttling
- QoS
See also:
The sfcluster label is required for the dashboard to work properly - be sure to add it in your Prometheus scrape config:
- job_name: solidfire_exporter
  honor_timestamps: true
  scrape_interval: 30s
  scrape_timeout: 20s
  metrics_path: /metrics
  scheme: http
  static_configs:
  - targets:
    - localhost:9987
    labels:
      sfcluster: sfcluster01

Data source config
Collector type:
Collector plugins:
Collector config:
Revisions
Upload an updated version of an exported dashboard.json file from Grafana
| Revision | Description | Created | |
|---|---|---|---|
| Download |