Kafka Streams Dashboard
Dashboard for a Kafka Streams application using Prometheus JMX-Exporter running in Kubernetes
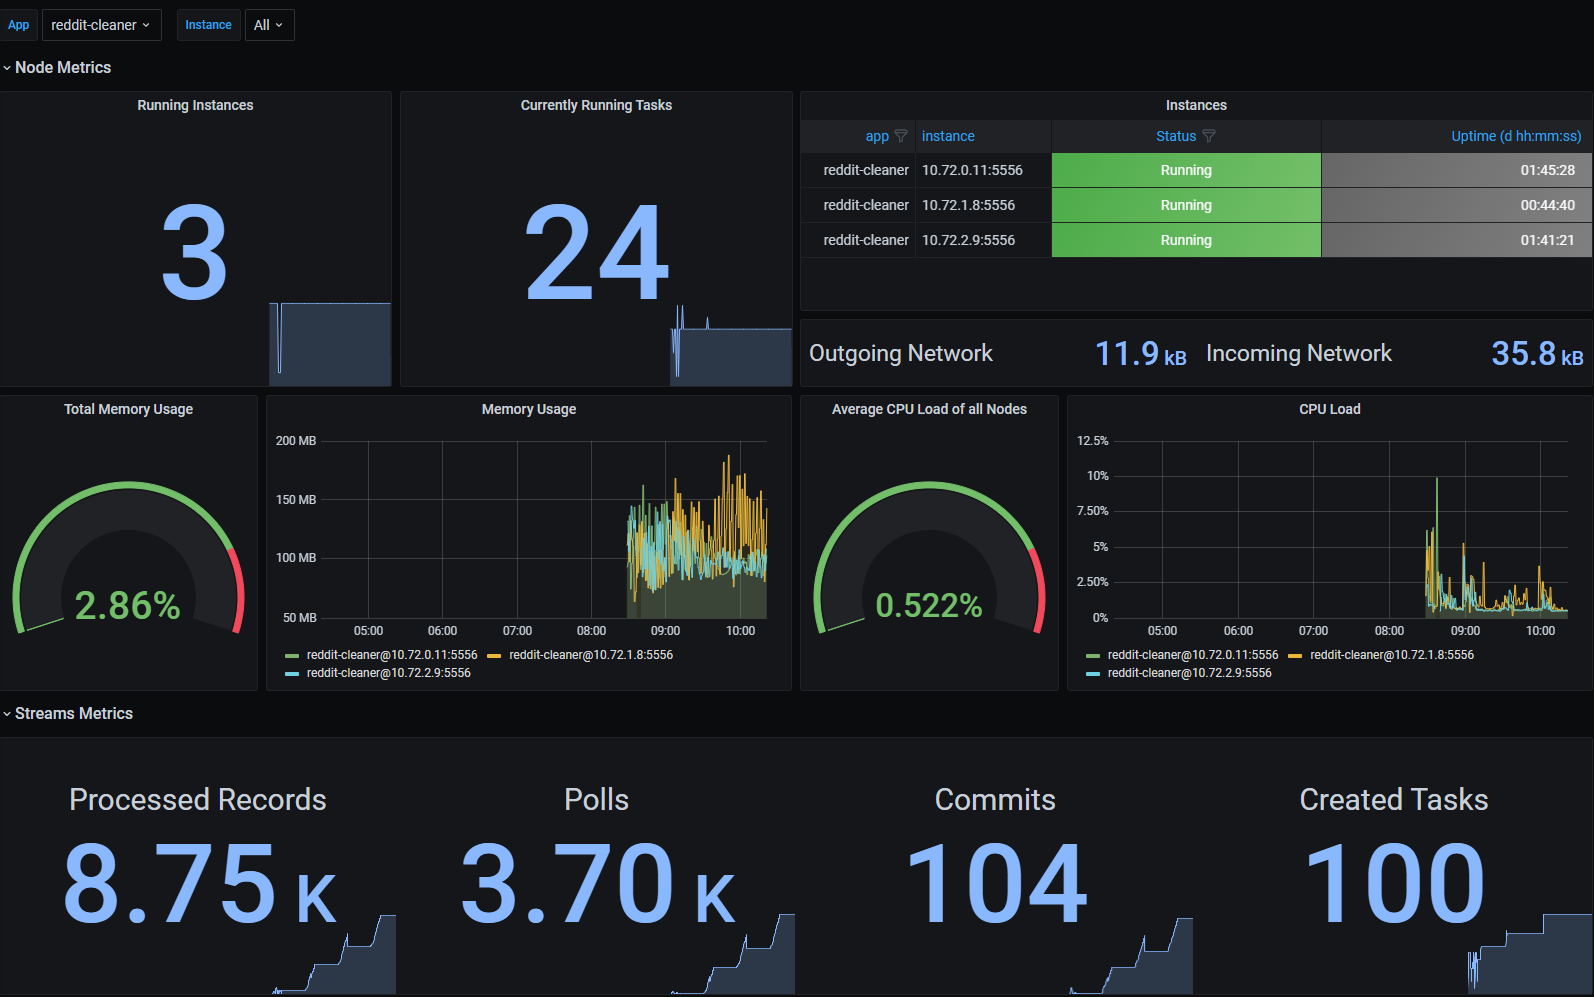
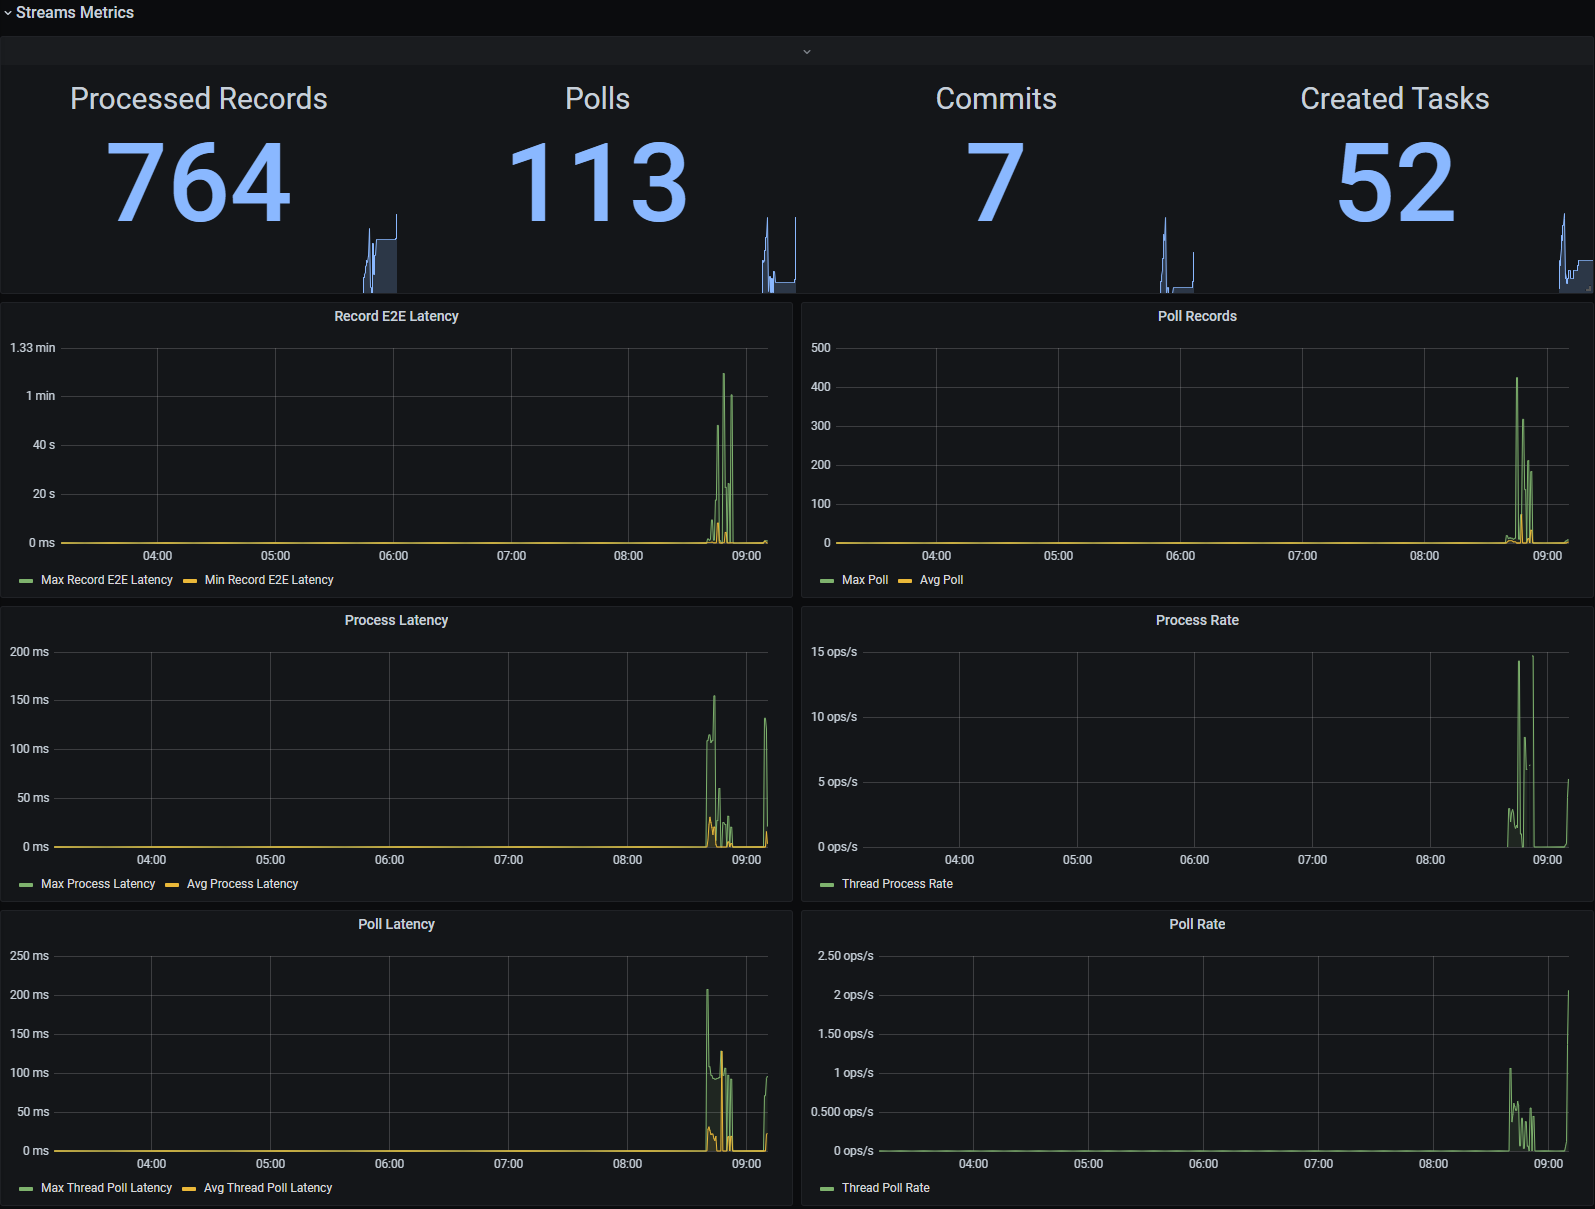
A Dashboard for Kafka Streams Applications running in Kubernetes.
Setup
Option A:
- Deploy a Kafka Streams App with Kubernetes. Make sure that the App exports JMX metrics (example is from sbt):
javaOptions in Universal += Seq(
  "-Dcom.sun.management.jmxremote.port=9186",
  "-Dcom.sun.management.jmxremote.rmi.port=9186",
  "-Dcom.sun.management.jmxremote.ssl=false",
  "-Dcom.sun.management.jmxremote.local.only=false",
  "-Dcom.sun.management.jmxremote.authenticate=false"
).mkString(" ")
- Start a sidecar prometheus exporter. You can use sscalling/jmx-prometheus-exporter.
- Check if prometheus is scraping your application. You can test this by checking the query result of
kafka_streams_kafka_metrics_count_count. - If prometheus is scraping correctly, the dashboard should work.
Option B:
- Deploy your application with the prometheus-jmx-exporter as java agent (see here
- No need for an additional sidecar container, your app exports prometheus metrics directly.
- Check if prometheus is scraping your application. You can test this by checking the query result of
kafka_streams_kafka_metrics_count_count. - If prometheus is scraping correctly, the dashboard should work.
Kubernetes Config
To automatically add your application to prometheus, use the following annotations in a kubernetes service:
annotations:
  prometheus.io/scrape: 'true'
  prometheus.io/port: '5556'
  prometheus.io/path: "/metrics"
Data source config
Collector type:
Collector plugins:
Collector config:
Revisions
Upload an updated version of an exported dashboard.json file from Grafana
| Revision | Description | Created | |
|---|---|---|---|
| Download |
Kafka
Easily monitor your Kafka deployment with Grafana Cloud's out-of-the-box monitoring solution.
Learn more