Netdata: Memcached Overview
Detailed stats for Memcached (connections, items, operations, etc)
About dashboard
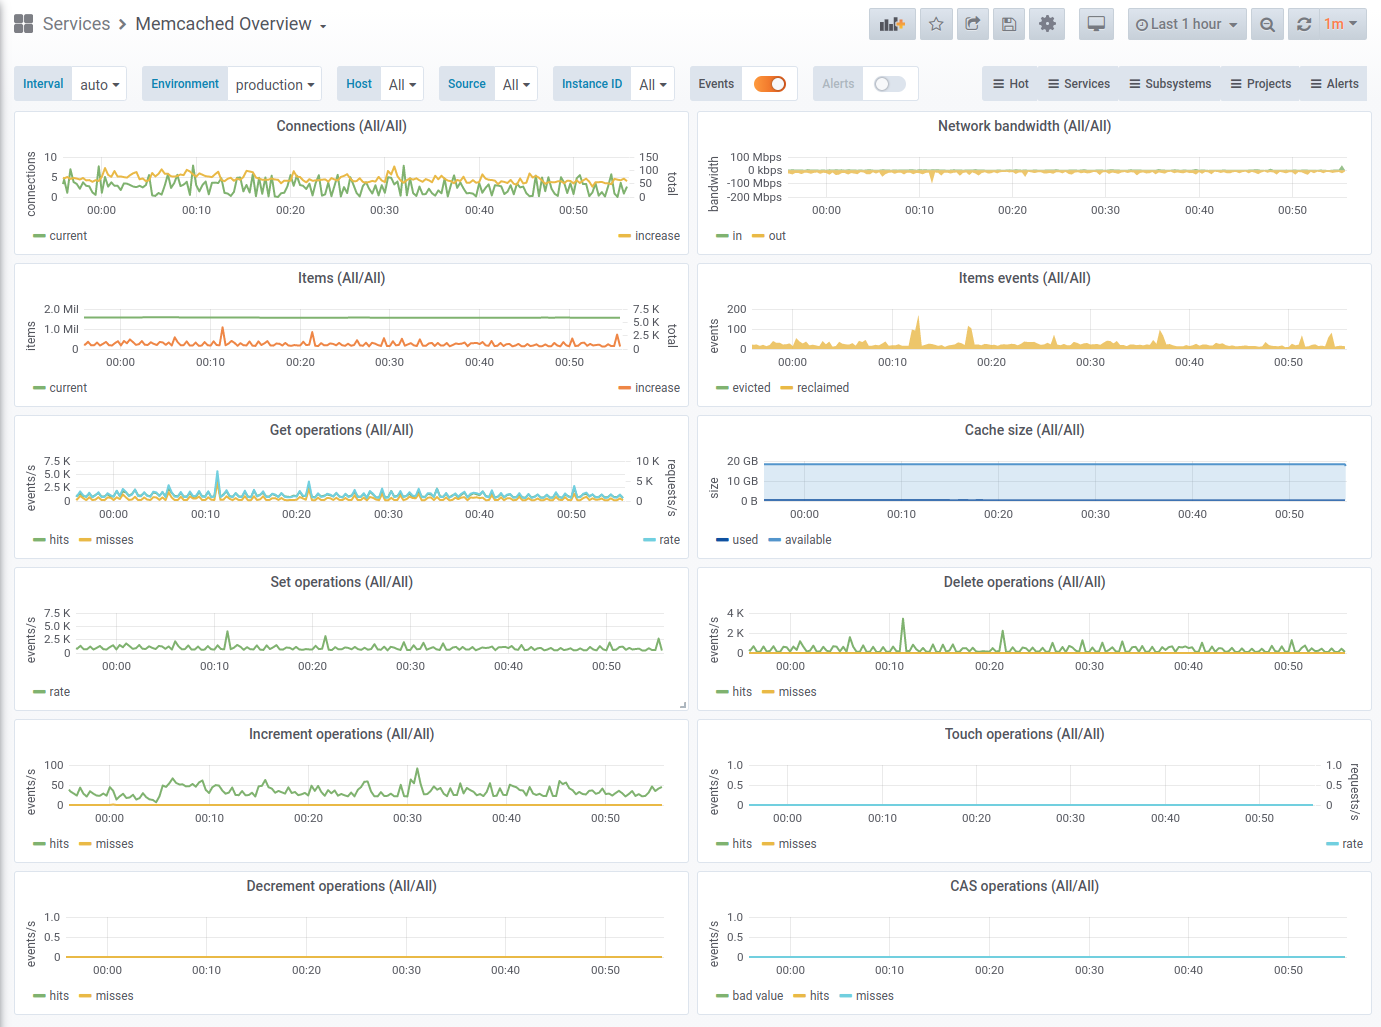
A dashboard with an overview for Memcached metrics:
- Connections (current and increase)
- Network bandwidth (in and out)
- Stored items (current and increase)
- Items events (reclaimed, evicted)
- Cache size (used, available)
- Get operations (hits, misses)
- Set operations (rate)
- Delete operations (his, misses)
- Increment operations (hits, misses)
- Decrement operations (hits, misses)
- Touch operations (hits, misses)
- CAS operations (hits, misses, bad value)
More dashboards for Netdata you can find here.
How to use
Netdata setup
Follow these instructions to setup Memcached monitoring in Netdata.
Prometheus setup
Please note that you need Netdata as an exporter for metrics. Plus, these labels are mandatory:
- job
- env
- instance
- group
- source
In your prometheus.yml it should look like this:
- job_name: netdata
  metrics_path: /api/v1/allmetrics?format=prometheus_all_hosts&source=raw
  relabel_configs:
  - source_labels: [__address__]
    regex: ^(.+)\.\w+:\d+
    target_label: instance
    action: replace
  static_configs:
  - targets: [netdata.hostname.here:19999]
    labels:
      env: production
      group: applications
      source: newproject
WARNING: Without these labels, this dashboard won't be fully functioning.
Links
License
GPL3
Author
OSSHelp Team, see https://oss.help
Data source config
Collector type:
Collector plugins:
Collector config:
Revisions
Upload an updated version of an exported dashboard.json file from Grafana
| Revision | Description | Created | |
|---|---|---|---|
| Download |
Memcached
Easily monitor Memcached, the distributed, in-memory key-value store, with Grafana Cloud's out-of-the-box monitoring solution.
Learn more