Netdata: PHP-FPM Overview
Detailed stats for PHP-FPM and Nginx (requests, connections, rates, etc)
About dashboard
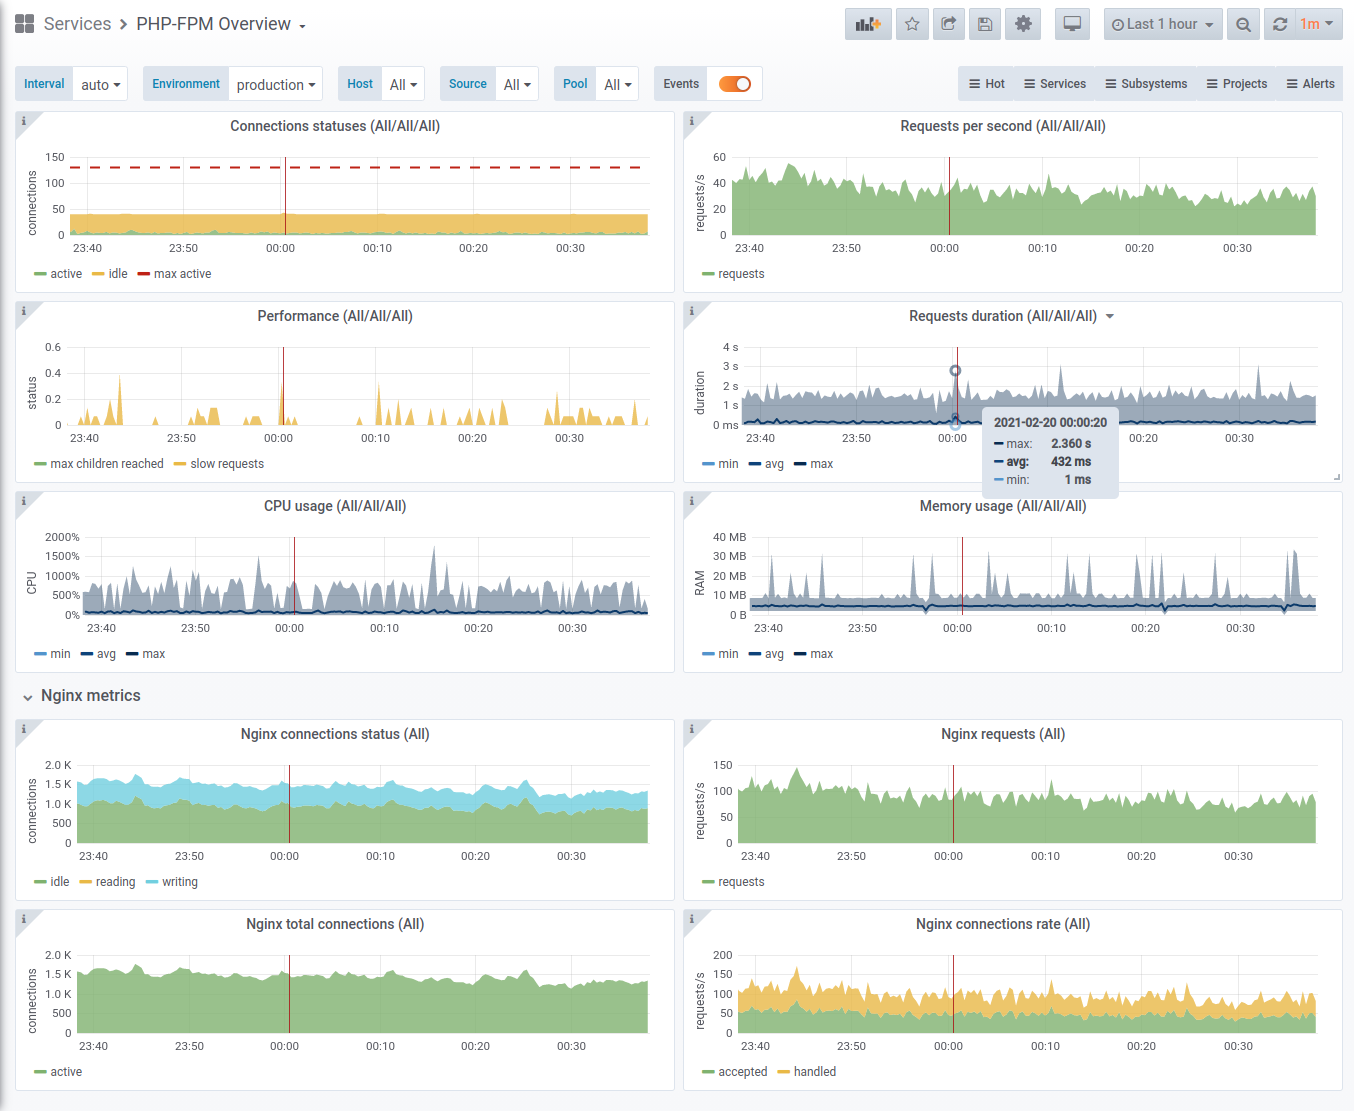
A dashboard with an overview for PHP-FPM metrics:
- Connections statuses
- Requests per seconds and requests duration
- Pool performance
- CPU and RAM usage
Also there are following Nginx metrics:
- Total connections and connections by status (idle, reading, writing)
- Global requests rate and rate by status (accepted, handled)
More dashboards for Netdata you can find here.
How to use
Netdata setup
Follow these instructions to setup PHP-FPM monitoring in Netdata.
Prometheus setup
Please note that you need Netdata as an exporter for metrics. Plus, these labels are mandatory:
- job
- env
- instance
- group
- source
In your prometheus.yml it should look like this:
- job_name: netdata
  metrics_path: /api/v1/allmetrics?format=prometheus_all_hosts&source=raw
  relabel_configs:
  - source_labels: [__address__]
    regex: ^(.+)\.\w+:\d+
    target_label: instance
    action: replace
  static_configs:
  - targets: [netdata.hostname.here:19999]
    labels:
      env: production
      group: applications
      source: newproject
WARNING: Without these labels, this dashboard won't be fully functioning.
Links
License
GPL3
Author
OSSHelp Team, see https://oss.help
Data source config
Collector type:
Collector plugins:
Collector config:
Revisions
Upload an updated version of an exported dashboard.json file from Grafana
| Revision | Description | Created | |
|---|---|---|---|
| Download |