tado° Dashboard
Grafana Dashboard for Prometheus eko/tado-exporter that shows the temperature setting, current temperature, humidity and activity for all rooms. A detailed view is shown based on the selected room. Using this exporter: https://github.com/IamTheLoki/tado-exporter
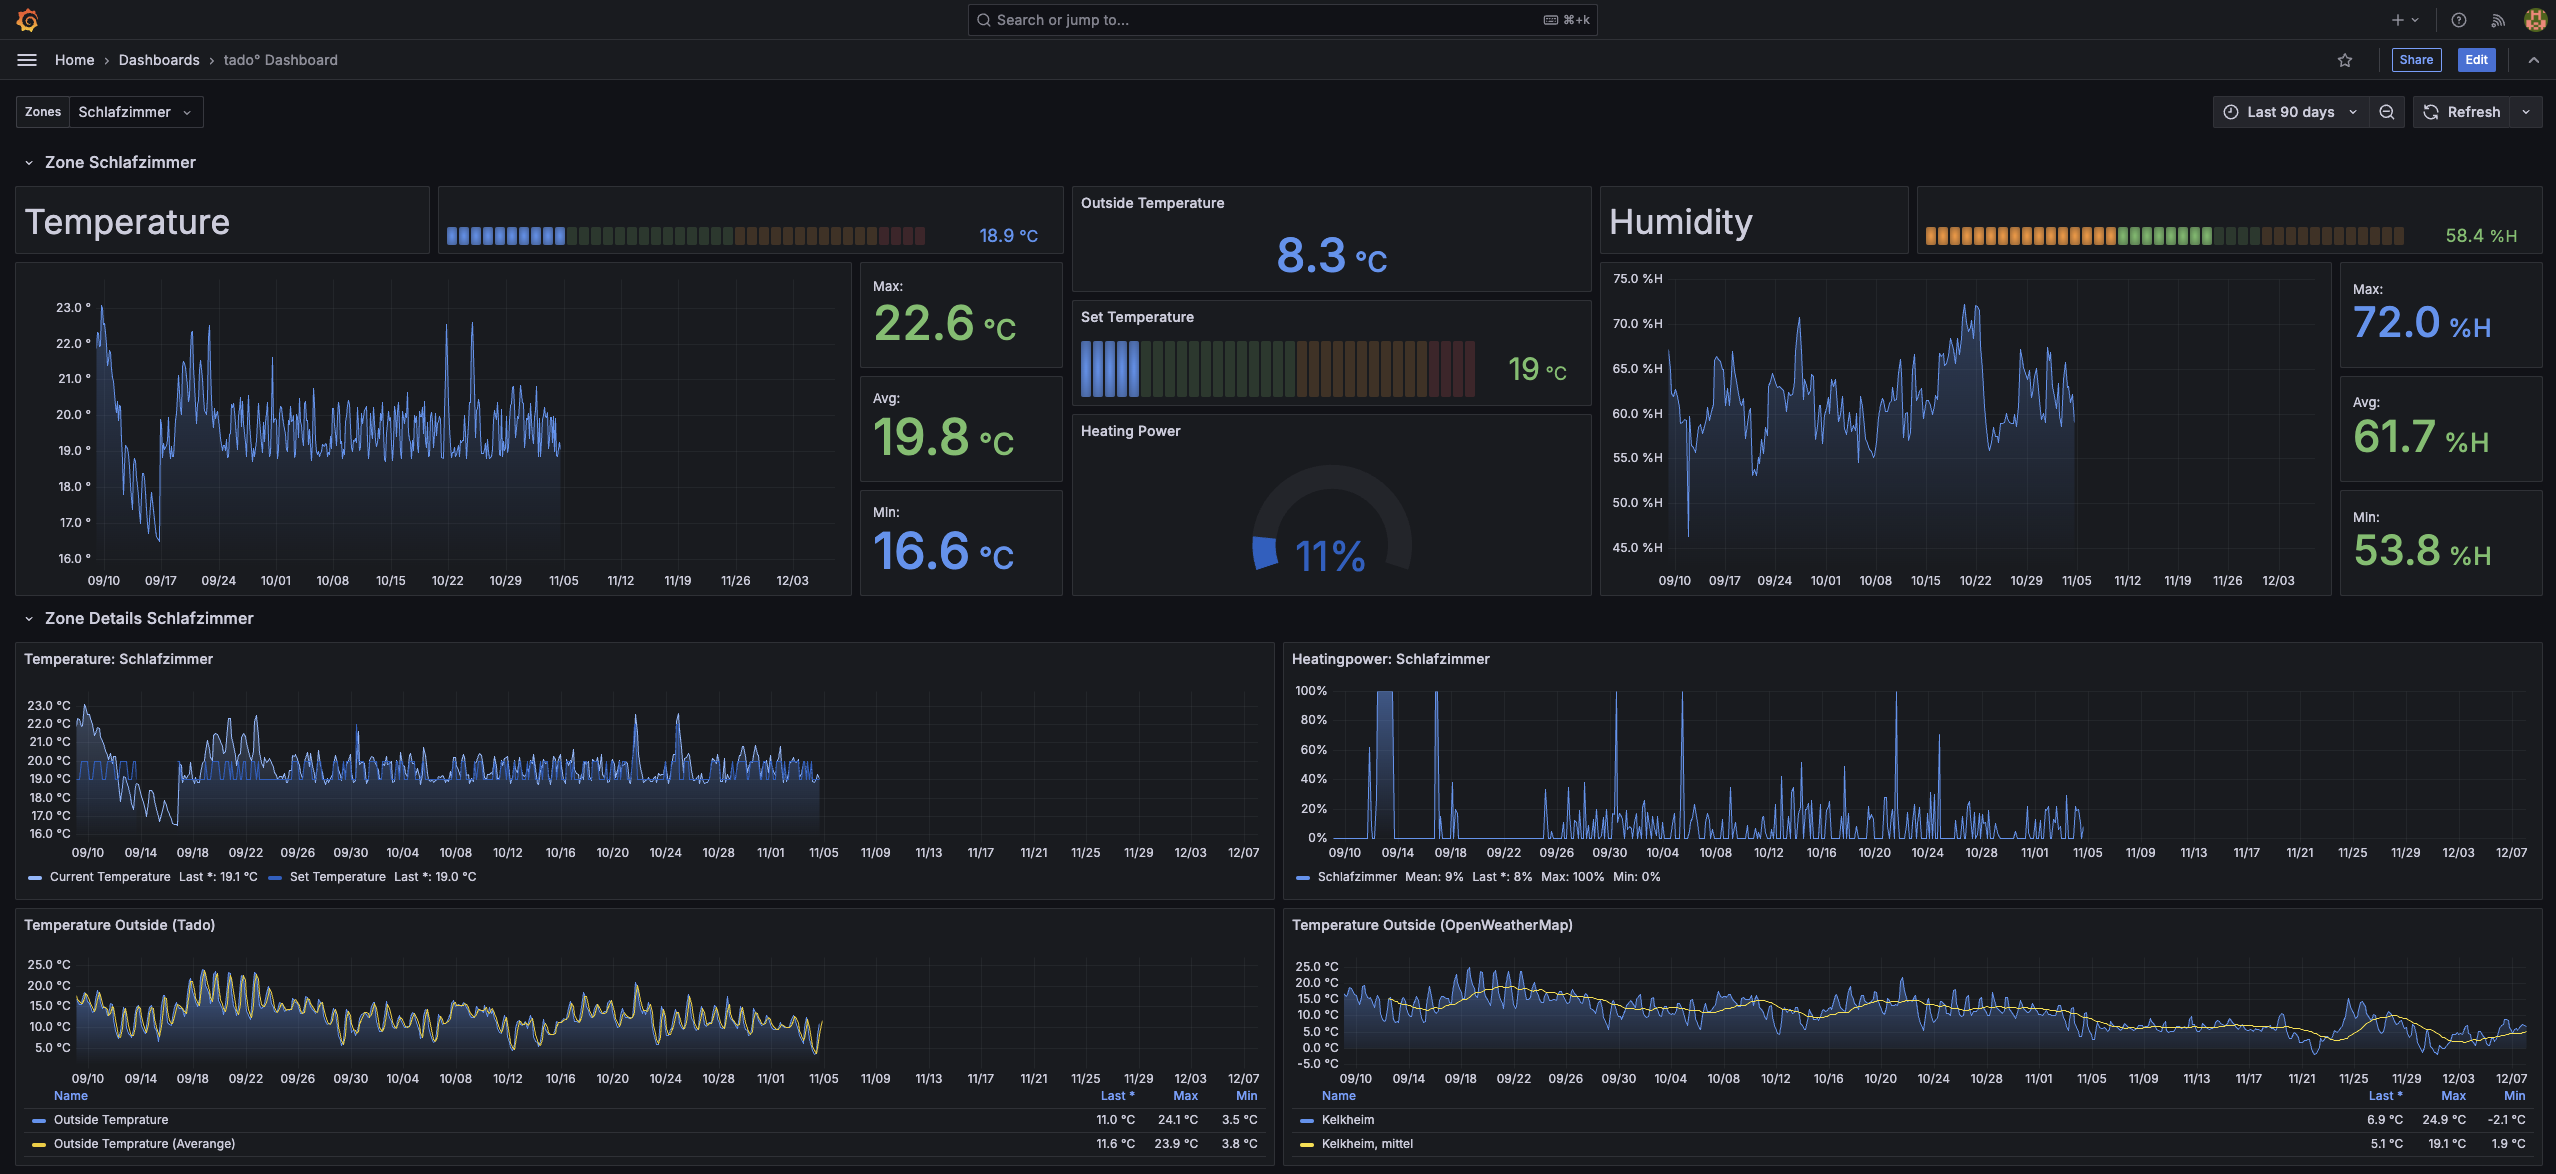
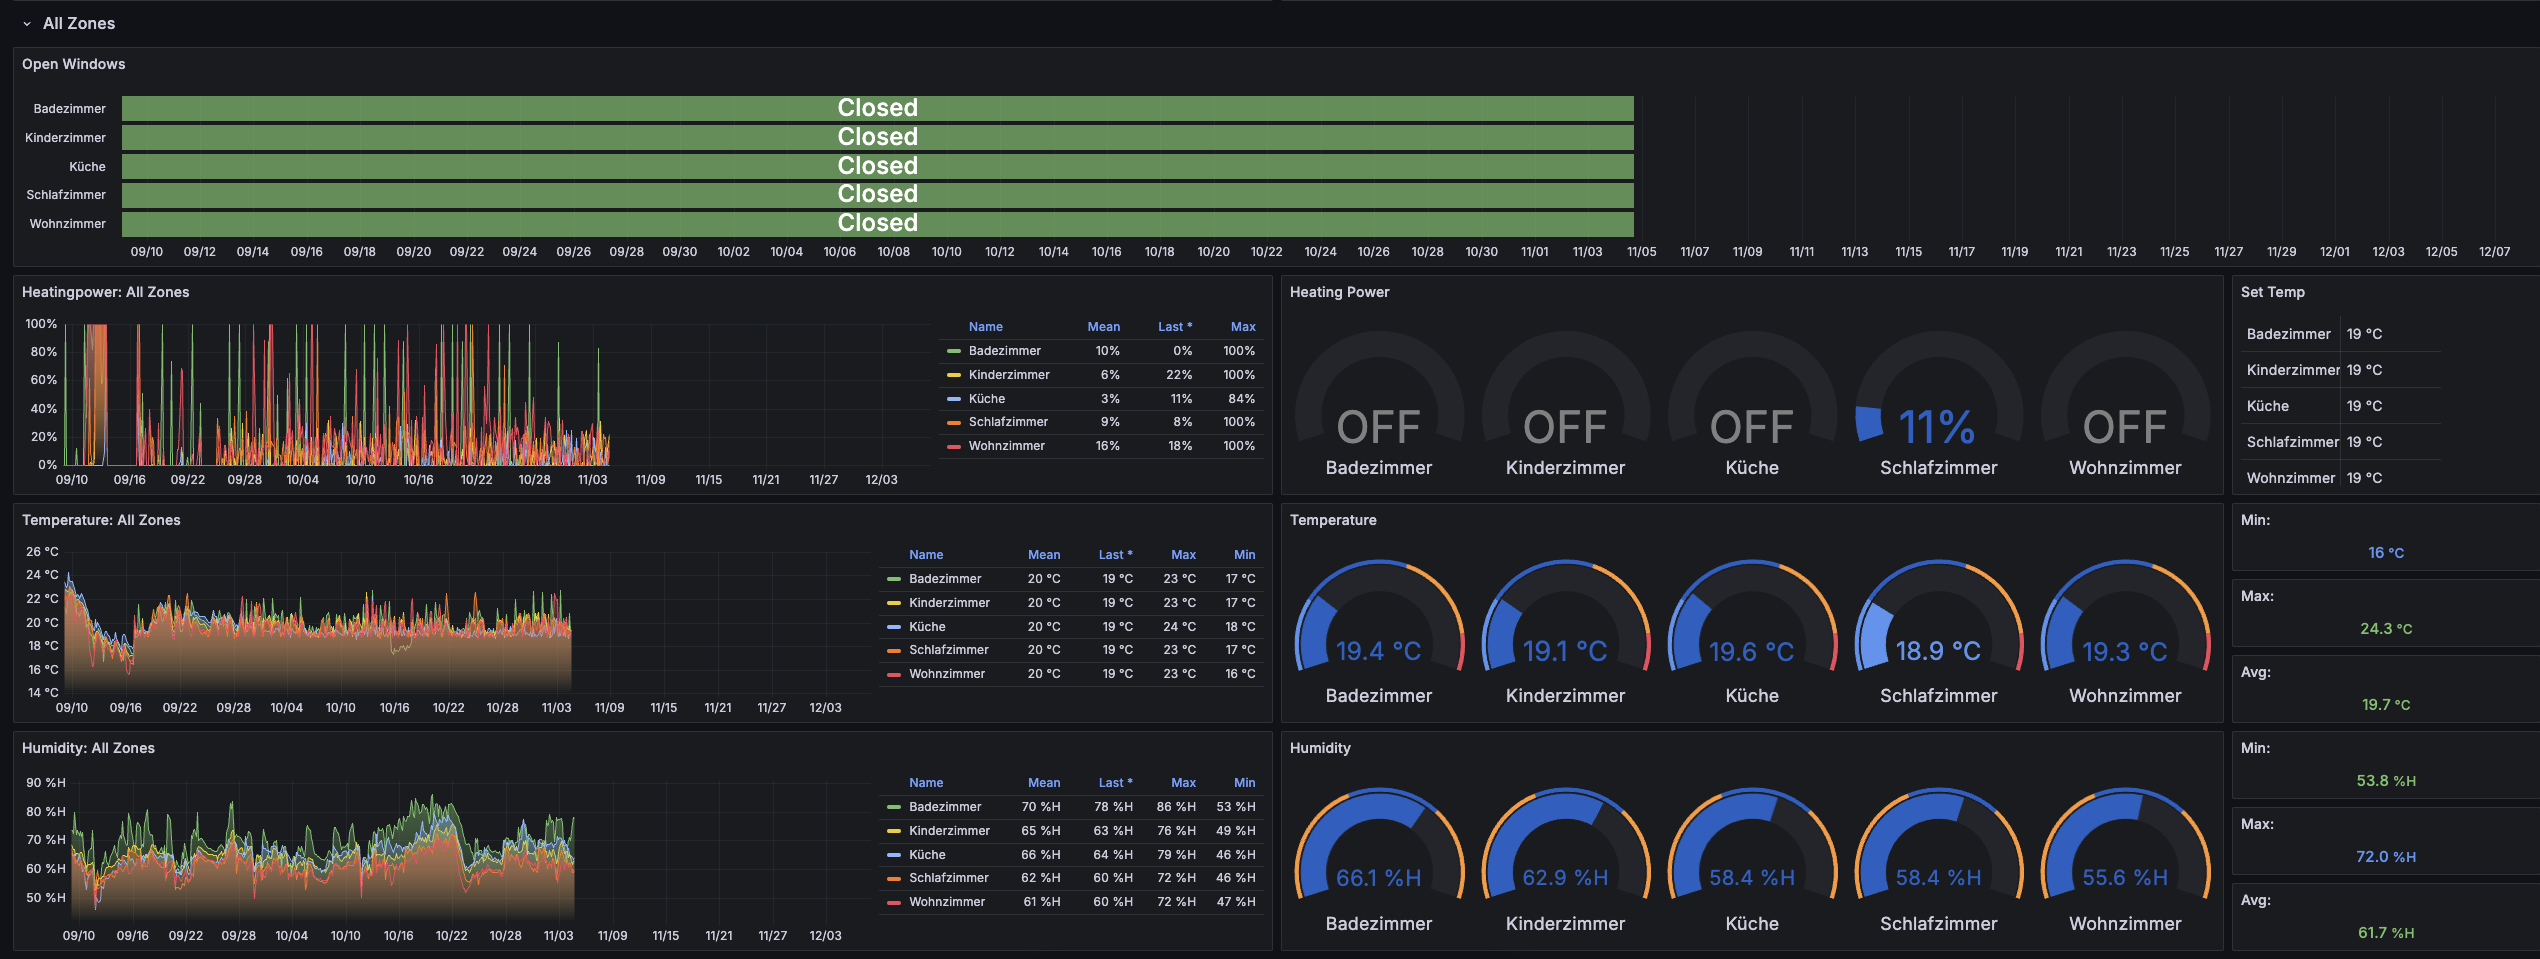
Grafana Dashboard for Prometheus IamTheLoki/tado-exporter that shows the temperature setting, current temperature, humidity and activity for all rooms. A detailed view is shown based on the selected room.
Using this exporter: https://github.com/IamTheLoki/tado-exporter
Data source config
Collector type:
Collector plugins:
Collector config:
Revisions
Upload an updated version of an exported dashboard.json file from Grafana
| Revision | Description | Created | |
|---|---|---|---|
| Download |