Unifi - Unifi Protect InfluxDB
Grafana Dashboard for Unifi Protect - InfluxDB
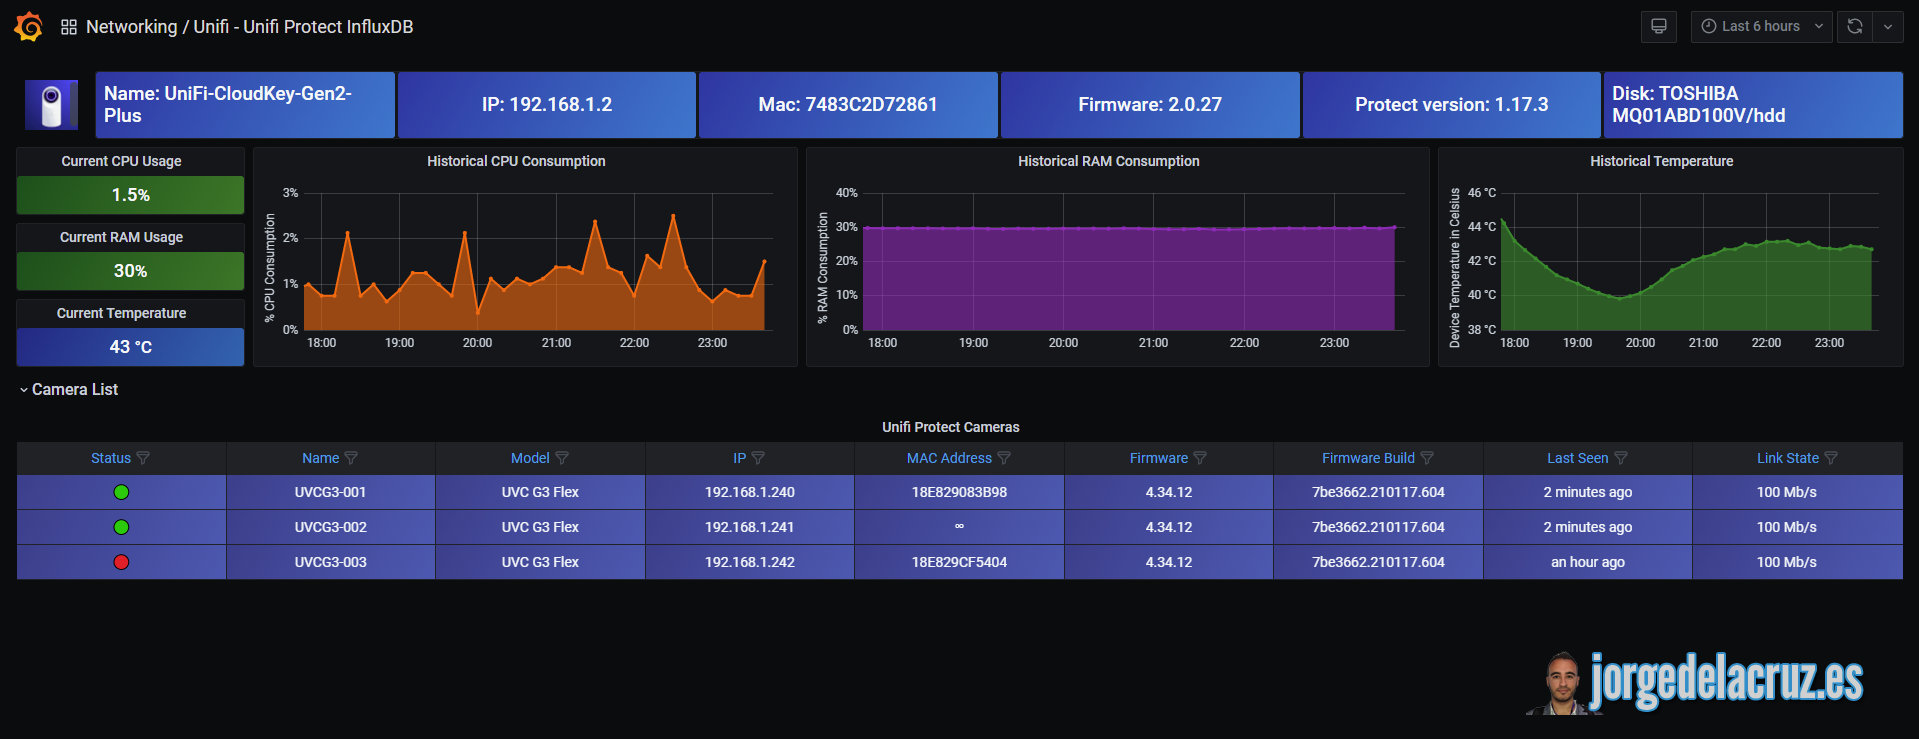
Grafana Dashboard for Unifi Protect - Using API to InfluxDB Script

This project consists in a Bash Shell script to retrieve the Unifi Protect information, directly from the API, about cameras, firmware, versions, CPU and RAM from the Protect Host, and much more. The information is being saved it into InfluxDB output directly into the InfluxDB database using curl, then in Grafana: a Dashboard is created to present all the information.
We use the Unifi Protect API to reduce the workload and increase the speed of script execution.
Getting started
You can follow the steps on the next Blog Post - To be created
Or try with this simple steps:
- Download the unifi-protect.sh file and change the parameters under Configuration, like username/password, etc. with your real data
- Make the script executable with the command chmod +x unifi-protect.sh
- Run the unifi-protect.sh and check on Chronograf/Grafana that you can retrieve the information properly
- Schedule the script execution, for example every 1 minute using crontab
- Download the Grafana Dashboard for Unifi Protect JSON file and import it into your Grafana
- Enjoy :)
Additional Information
- Nothing to add as of today
Known issues
Would love to see some known issues and keep opening and closing as soon as I have feedback from you guys. Fork this project, use it and please provide feedback.
Data source config
Collector config:
Upload an updated version of an exported dashboard.json file from Grafana
| Revision | Description | Created | |
|---|---|---|---|
| Download |
InfluxDB
Easily monitor InfluxDB, an open source time series database, with Grafana Cloud's out-of-the-box monitoring solution.
Learn more