Ambassador Edge Stack
Ambassador Edge Stack dashboard for Prometheus
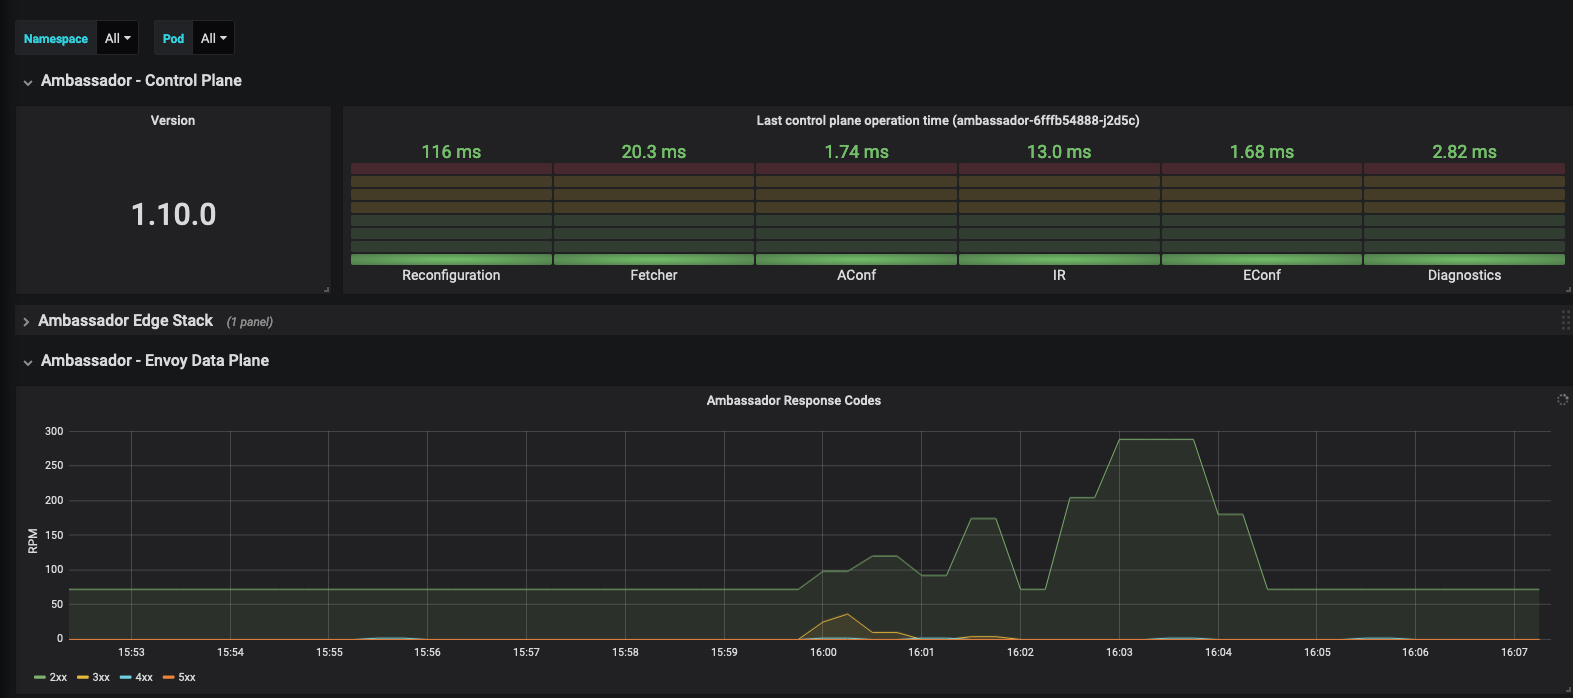
Displays control plane and data plane statistics collected from the :8877/metrics endpoint of the Ambassador Edge Stack.
Details about the meaning of these statistics can be found in the Ambassador documentation
Data source config
Collector type:
Collector plugins:
Collector config:
Revisions
Upload an updated version of an exported dashboard.json file from Grafana
| Revision | Description | Created | |
|---|---|---|---|
| Download |