Netdata: Apps Stats
Per application overview (CPU/RAM/Disk/etc)
About dashboard
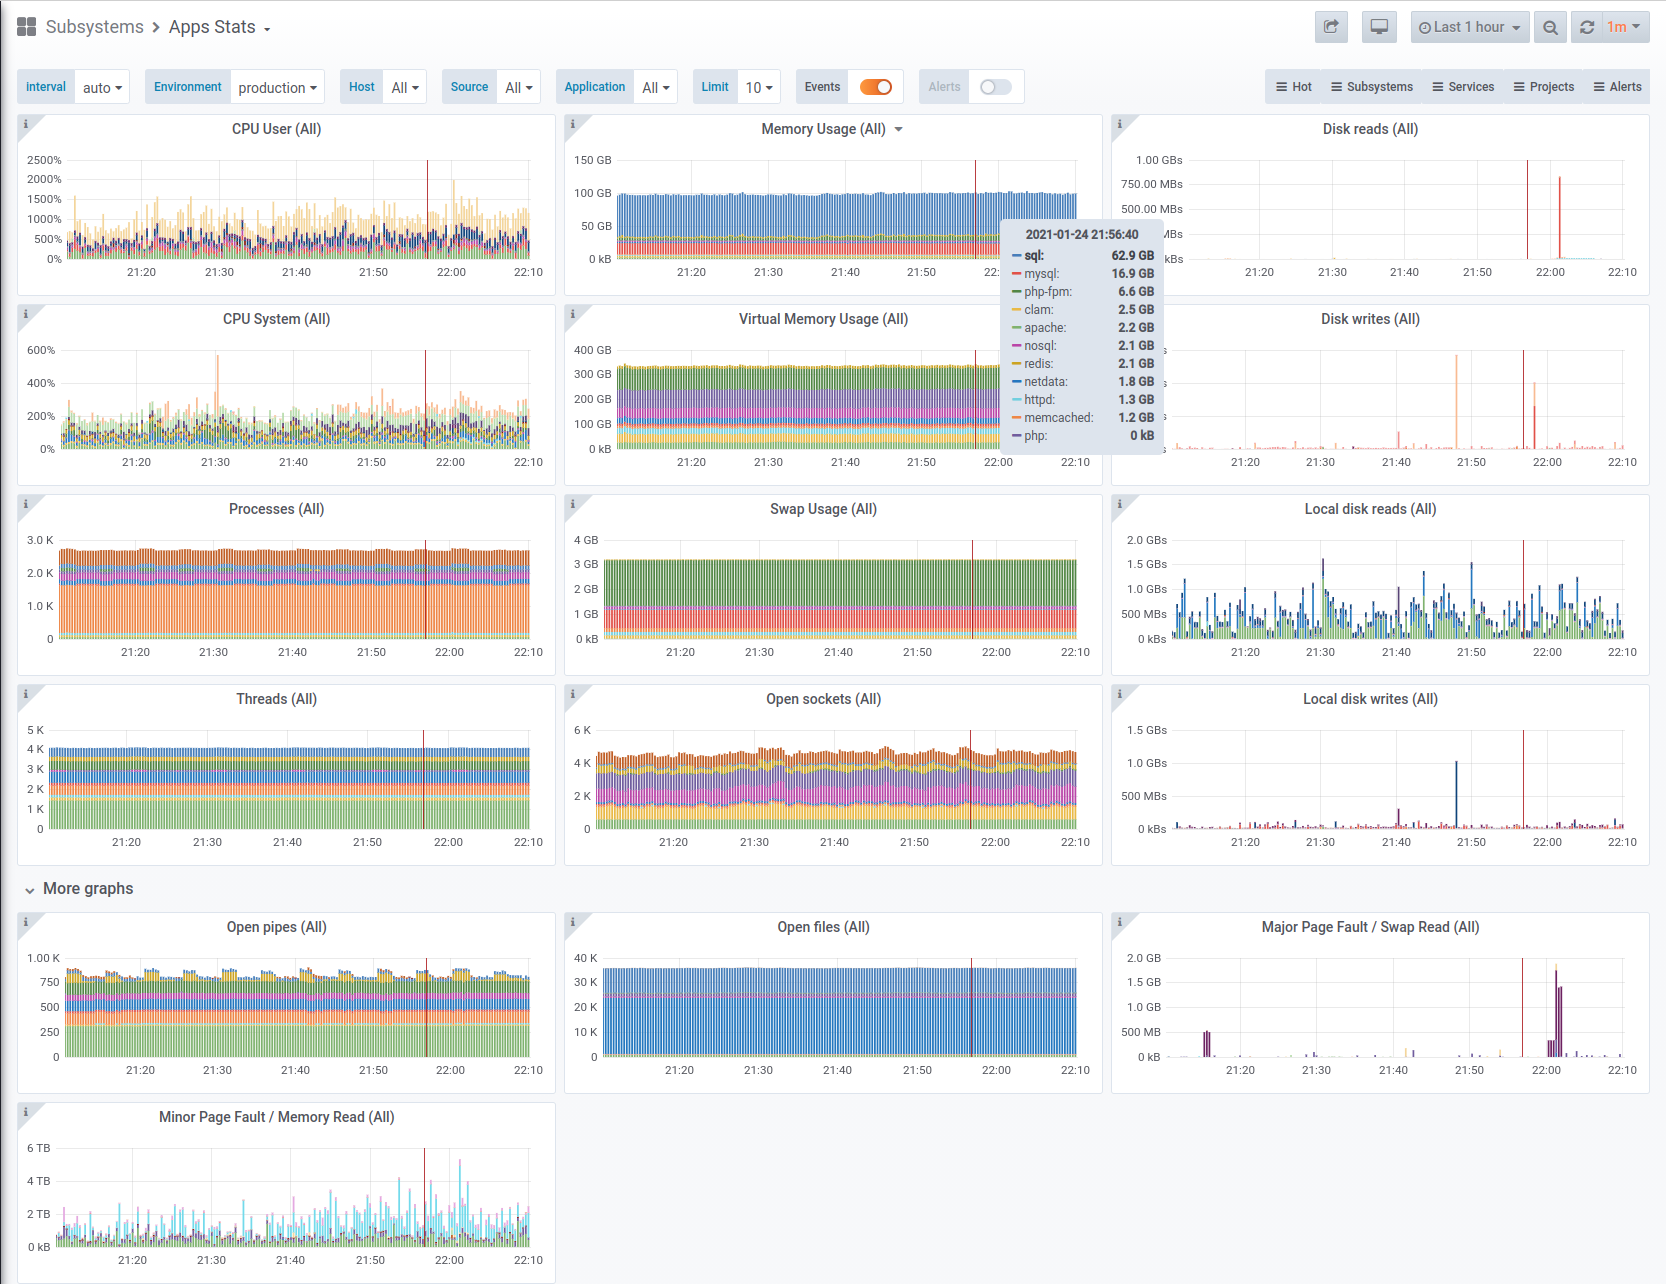
A simple dashboard with an overview for running applications:
- CPU (user and system)
- RAM and swap
- Disks I/O
- Network bandwidth and PPS
- Process and threads
- Number of open files, sockets, pipes
- Minor and major page faults
More dashboards for Netdata you can find here.
How to use
Netdata setup
Follow these instructions to setup applications monitoring in Netdata.
Prometheus setup
Please note that you need Netdata as an exporter for metrics. Plus, these labels are mandatory:
- job
- env
- instance
- group
- source
In your prometheus.yml it should look like this:
- job_name: netdata
  metrics_path: /api/v1/allmetrics?format=prometheus_all_hosts&source=raw
  relabel_configs:
  - source_labels: [__address__]
    regex: ^(.+)\.\w+:\d+
    target_label: instance
    action: replace
  static_configs:
  - targets: [netdata.hostname.here:19999]
    labels:
      env: production
      group: applications
      source: newproject
WARNING: Without these labels, this dashboard won't be fully functioning.
Links
License
GPL3
Author
OSSHelp Team, see https://oss.help
Data source config
Collector type:
Collector plugins:
Collector config:
Revisions
Upload an updated version of an exported dashboard.json file from Grafana
| Revision | Description | Created | |
|---|---|---|---|
| Download |