Mikrotik MKTXP Exporter
Mikrotik MKTXP Exporter metrics
![]()
![]()
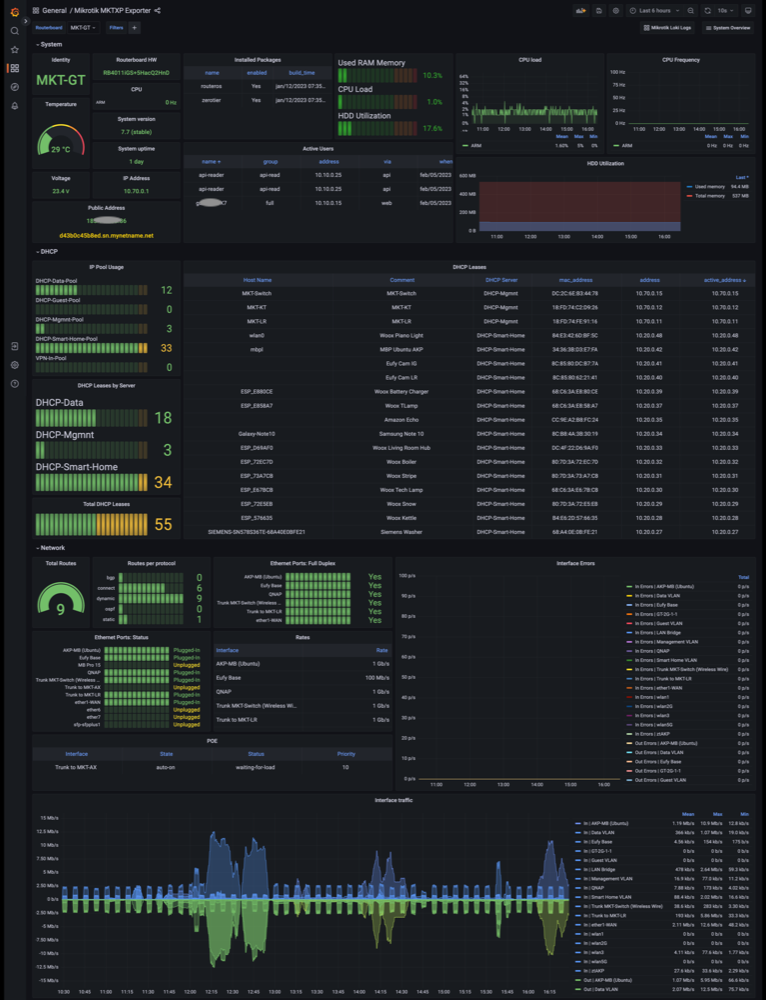
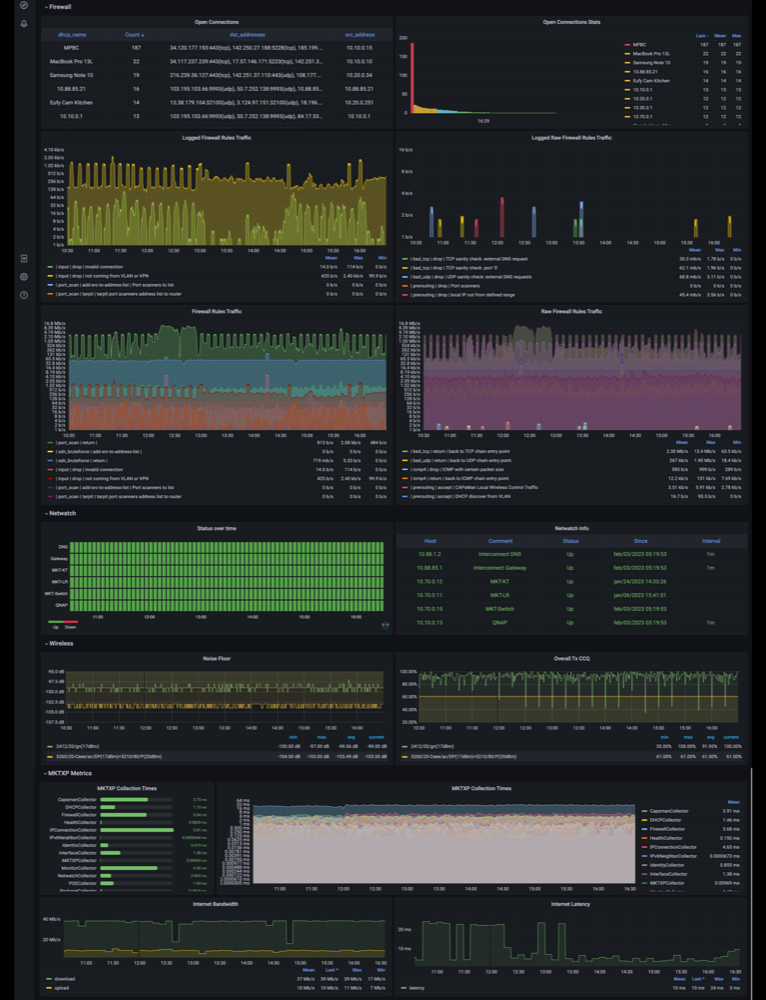
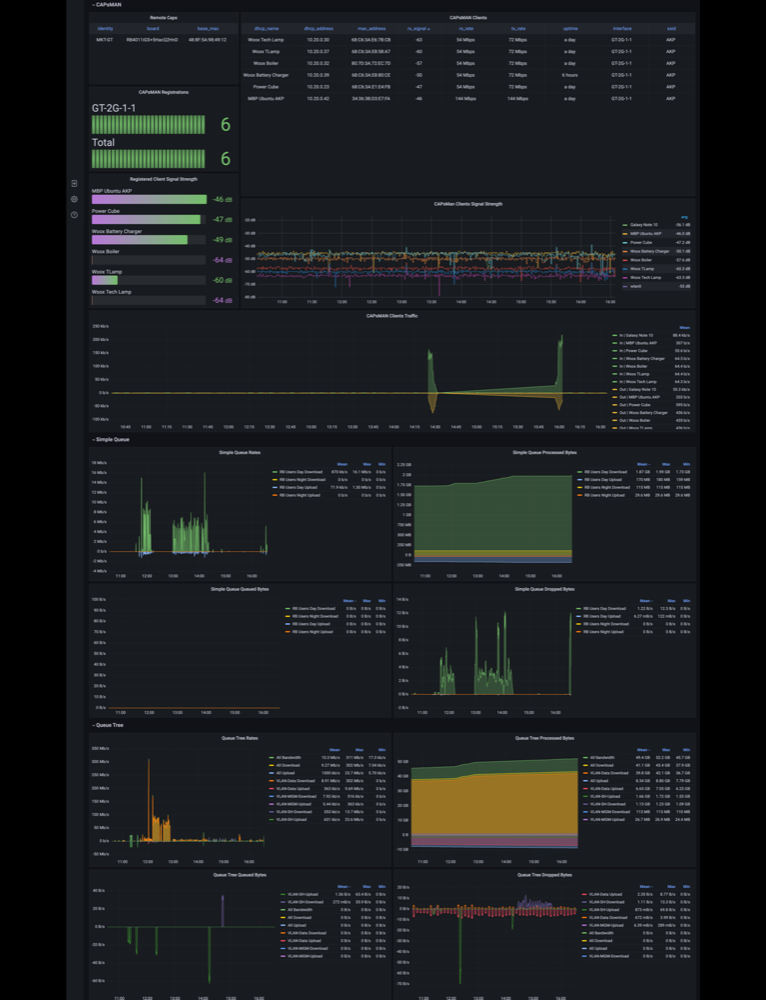
Mikrotik RouterOS metrics with Prometheus, collected with MKTXP exporter
This dashboard is now a part of MKTXP-Stack, a dockerized monitoring stack to have multiple Mikrotik RouterOS devices monitored with least amount of configuration.
Data source config
Collector type:
Collector plugins:
Collector config:
Revisions
Upload an updated version of an exported dashboard.json file from Grafana
| Revision | Description | Created | |
|---|---|---|---|
| Download |