mx-puppet-bridge Detail
Detailed view of the metrics exported by mx-puppet-bridge
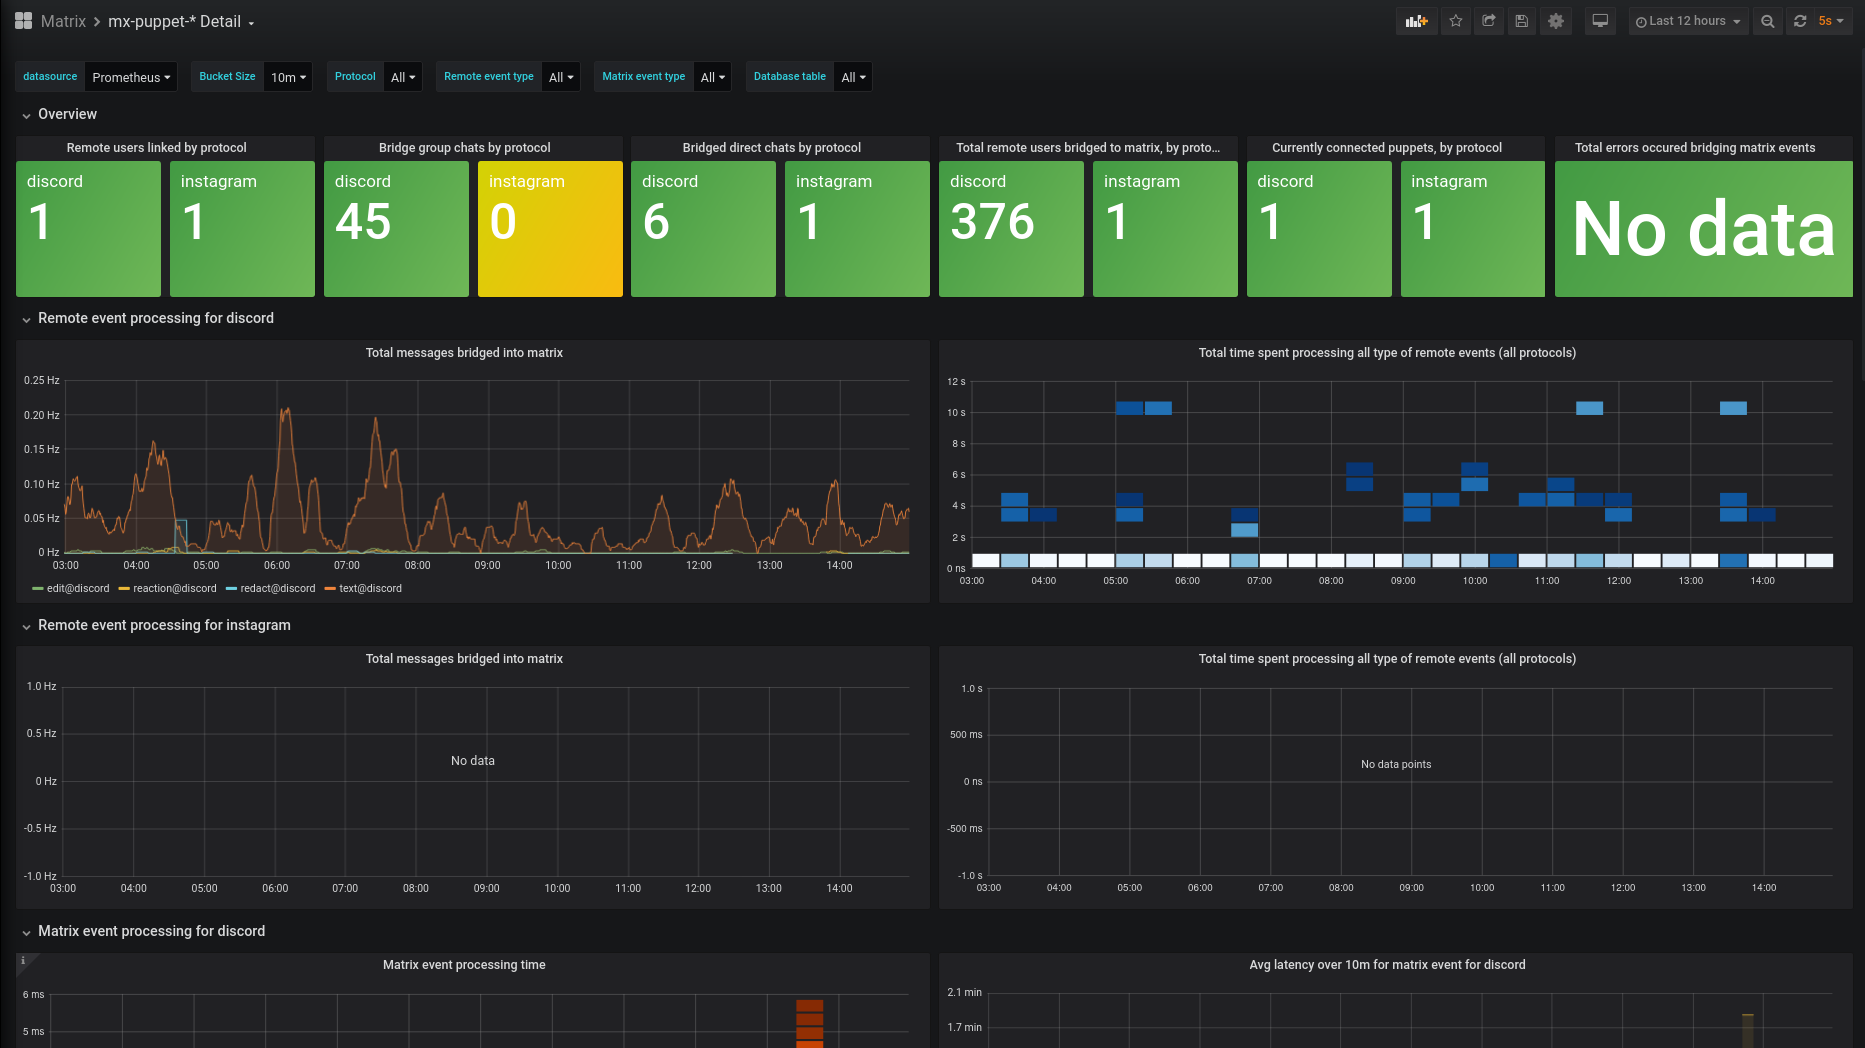
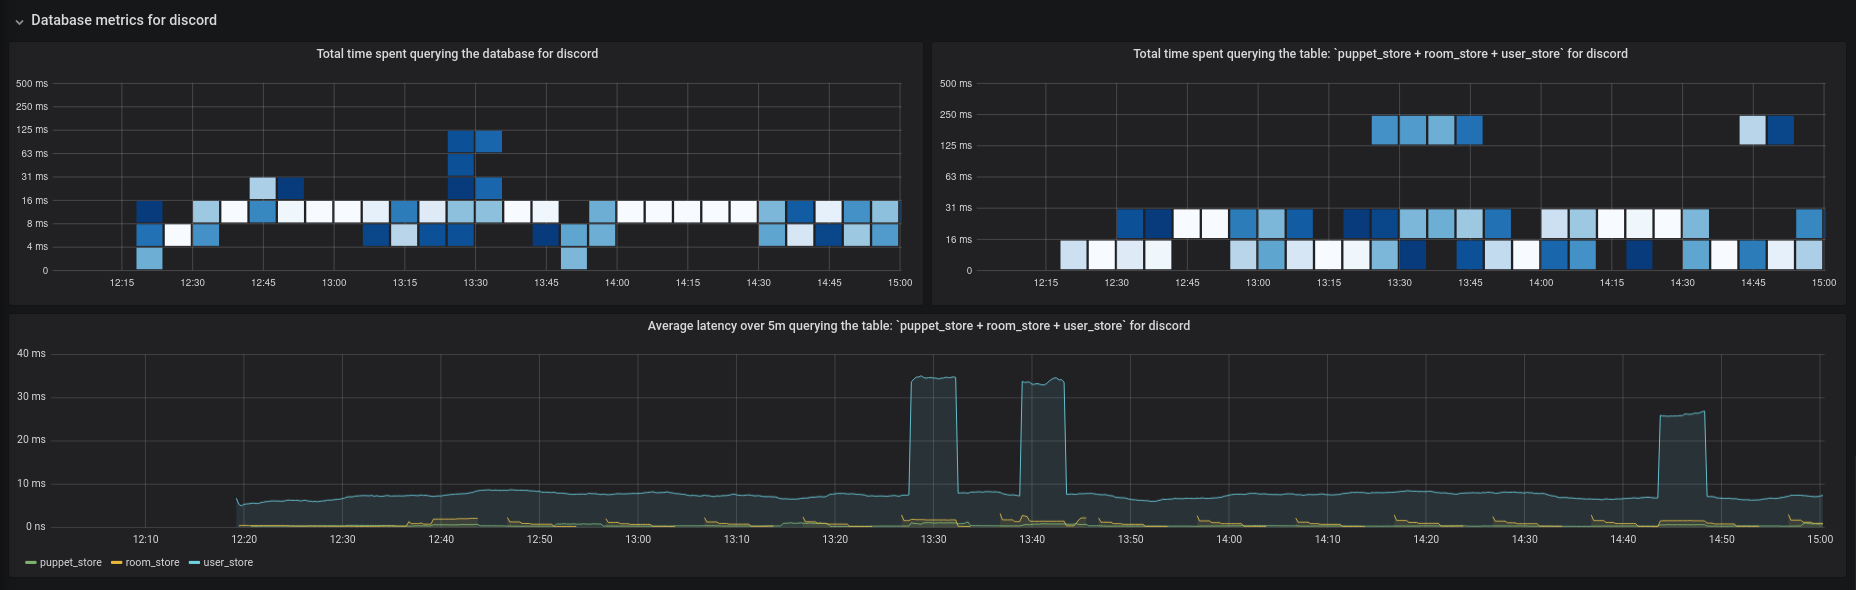
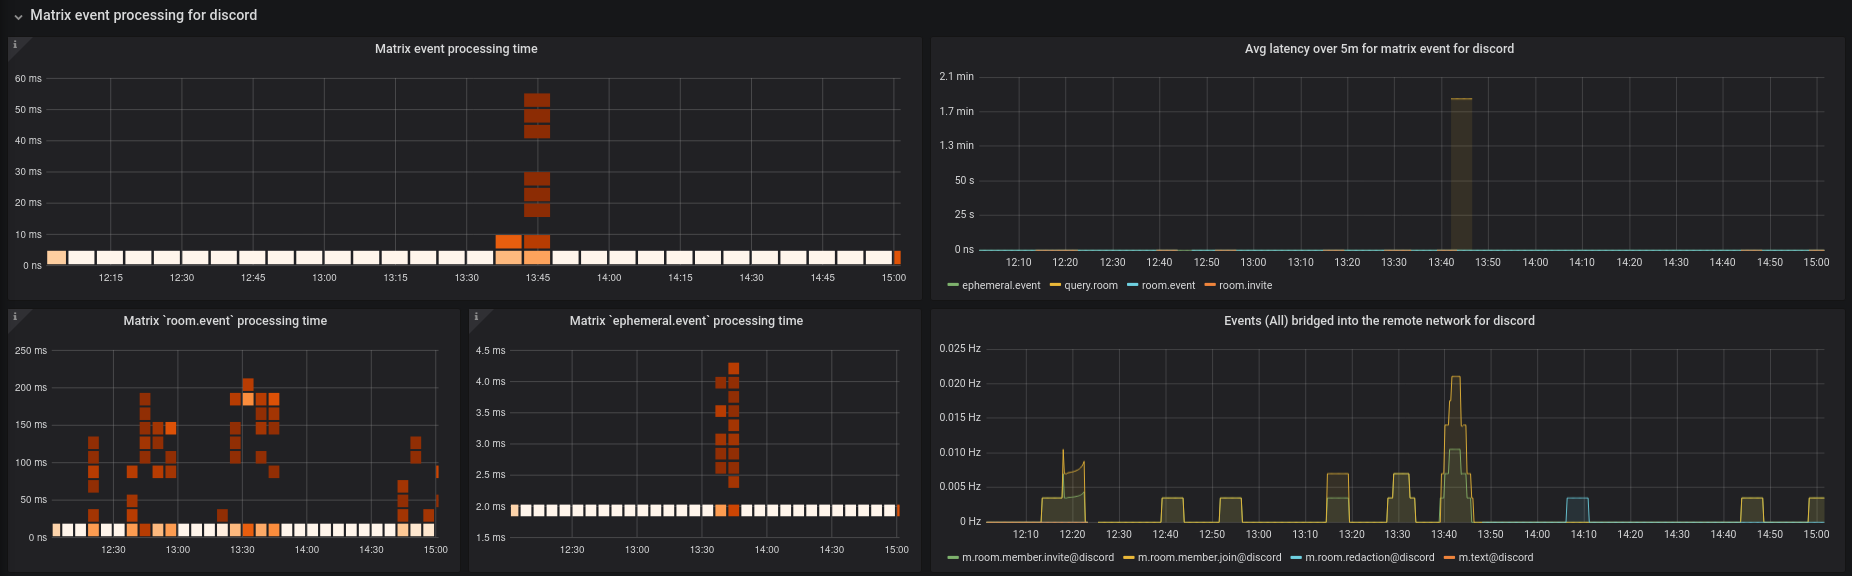
This dashboard groups metrics from mx-puppet-bridge into database, remote update and matrix event rows, seperated by protocol.
For analysis of database latencies, different event types etc, this dashboard features several variables for more fine-tuned control of the visualizations
Data source config
Collector type:
Collector plugins:
Collector config:
Revisions
Upload an updated version of an exported dashboard.json file from Grafana
| Revision | Description | Created | |
|---|---|---|---|
| Download |