Tado
This dashboard uses a Prometheus exporter for the Tado thermostat to simply show the temperature, humidity and heating settings.
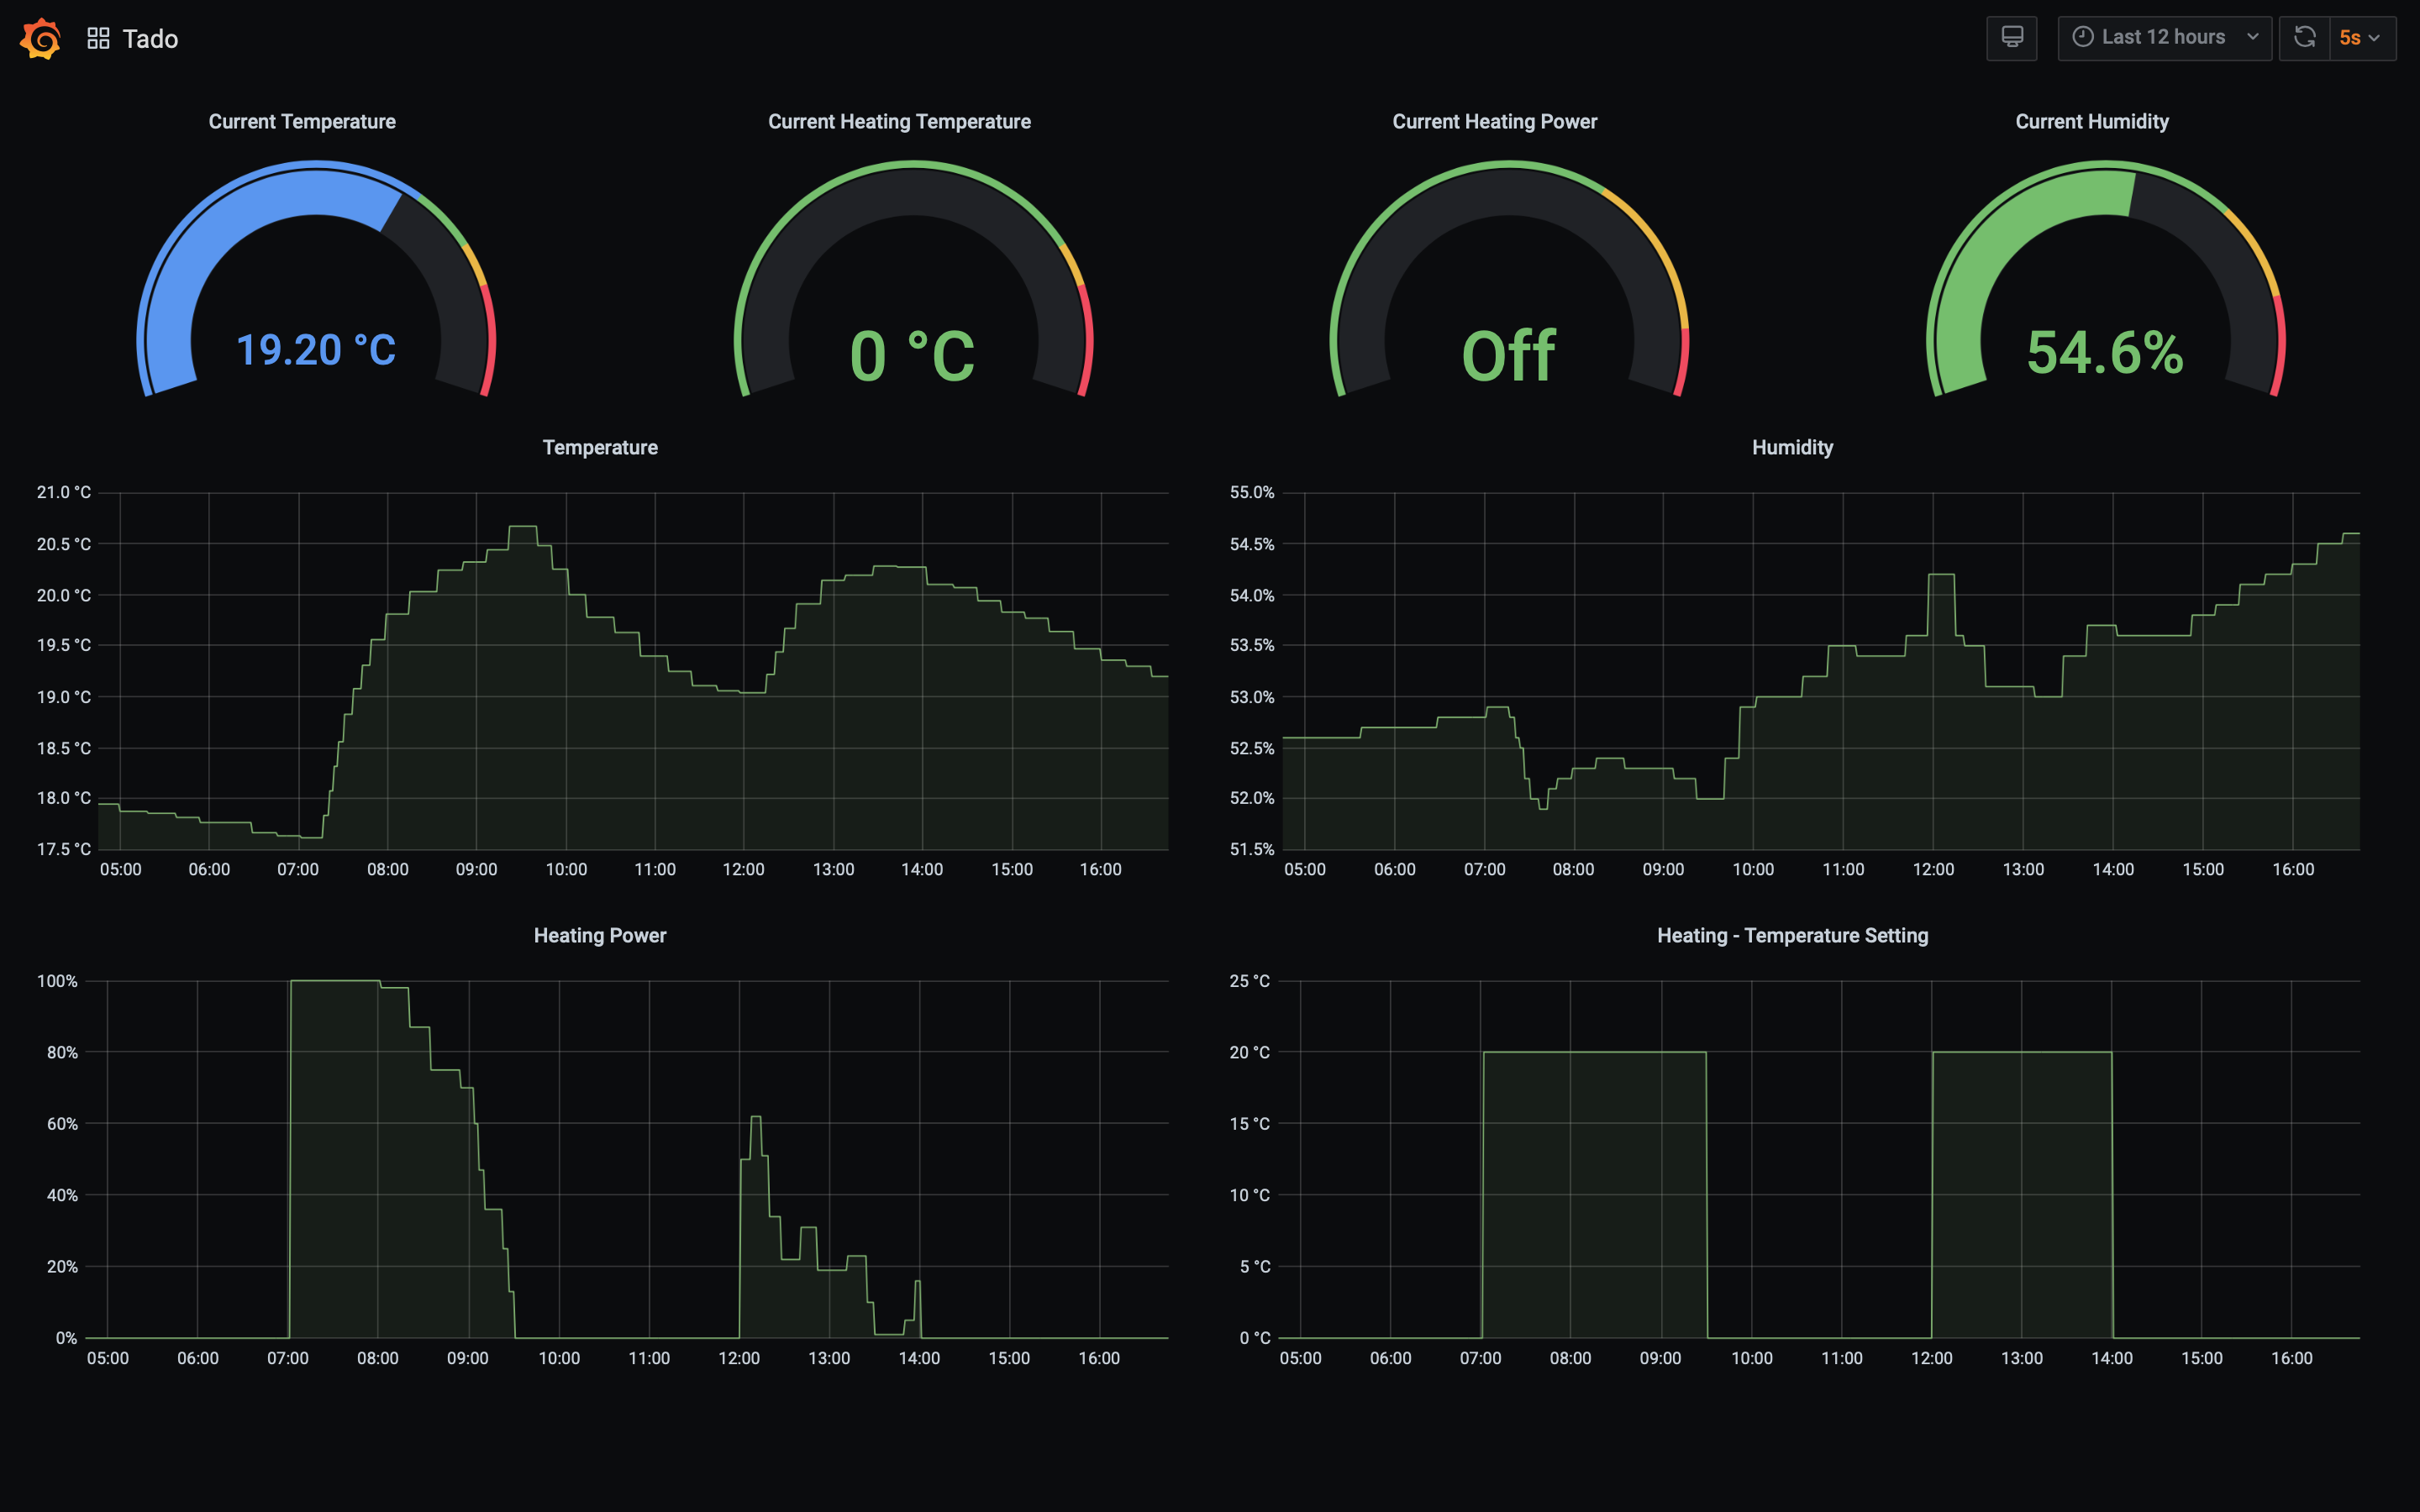
This dashboard assumes that you only have one heating zone.
It is also set up to use celsius (℃). You will need to make changes throughout to change this to Fahrenheit.
The recommended exporter does provide a Fahrenheit value. This can be accessed by changing unit="celsius" to unit="fahrenheit" in all the Prometheus queries -- you won't need to calculate it.
The exporter I've used is eko's tado-exporter.
Despite this, I don't doubt that it could very easily be adapted to support another exporter.
I've also published the docker-compose.yml file that I use to run the Prometheus, Grafana and tado-exporter stack. This can be found on GitHub here.
Data source config
Collector config:
Upload an updated version of an exported dashboard.json file from Grafana
| Revision | Description | Created | |
|---|---|---|---|
| Download |