9103 - Squid
Prometheus Squid exporter metrics.
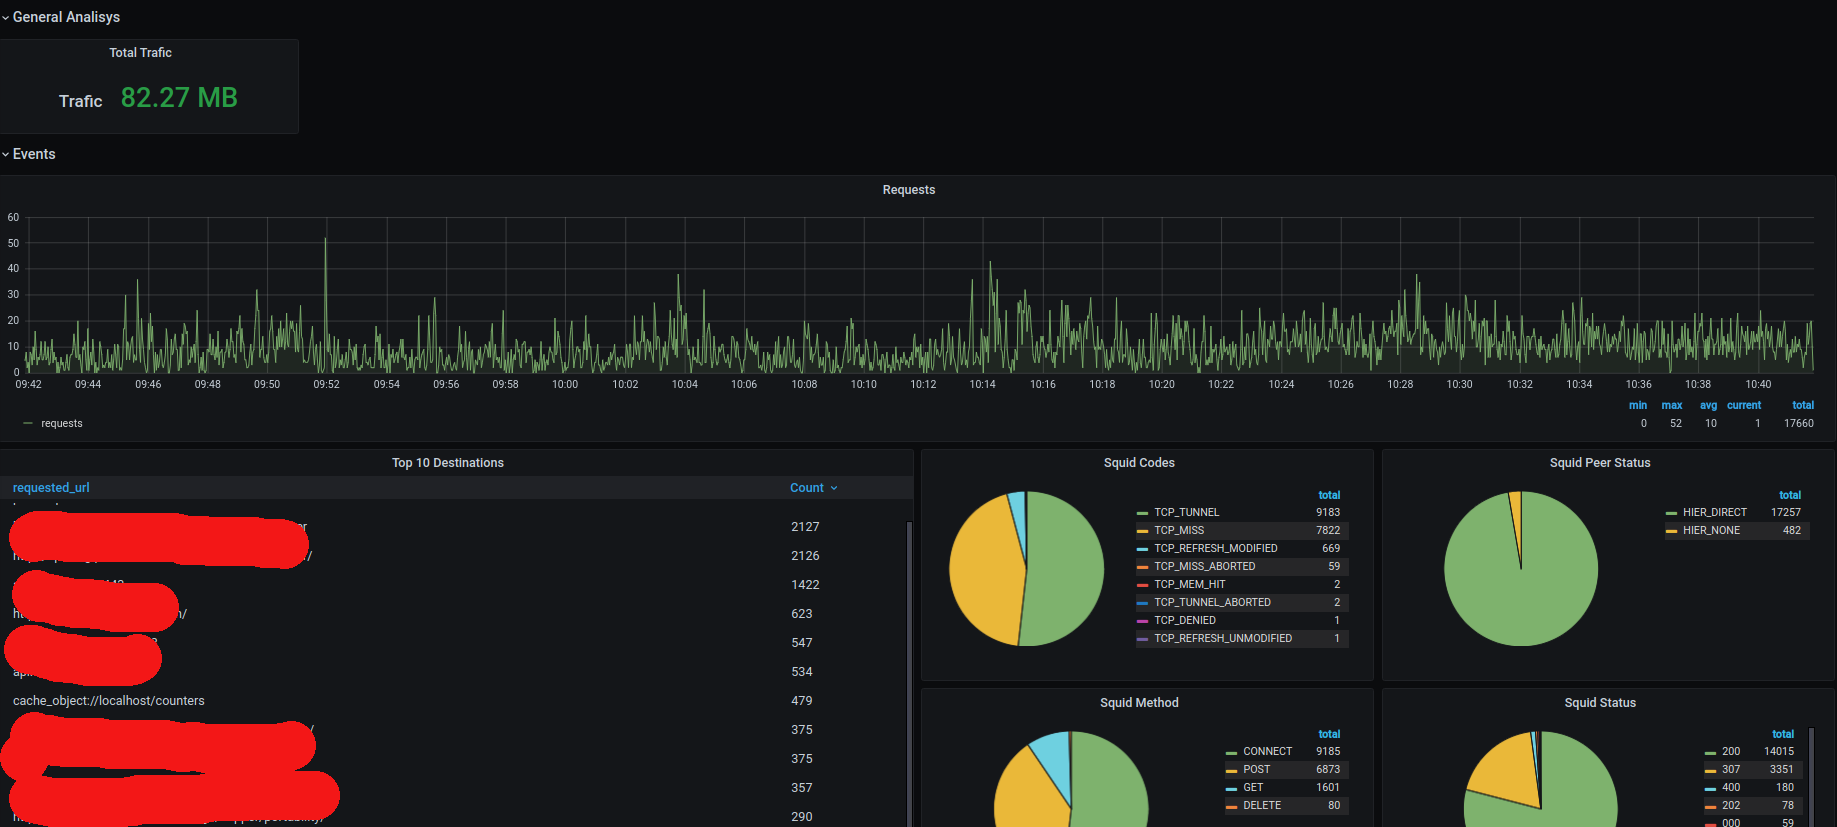
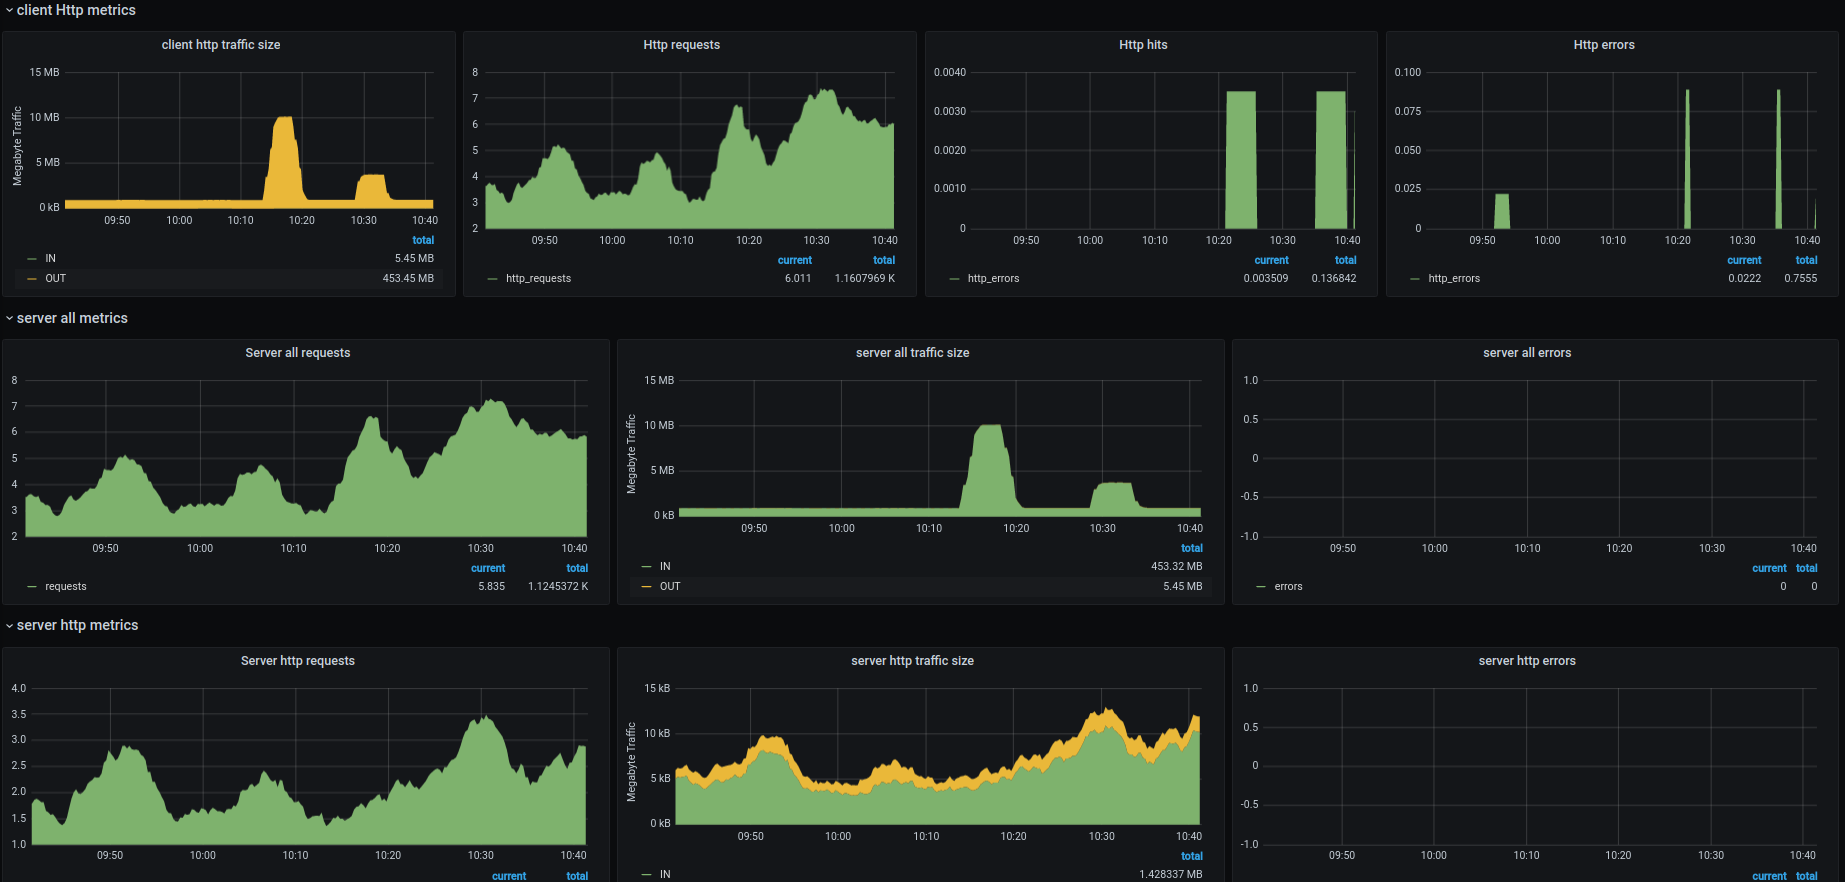
The 9103 - Squid dashboard uses the elasticsearch and prometheus data sources to create a Grafana dashboard with the grafana-piechart-panel, graph, singlestat and table-old panels.
Data source config
Collector type:
Collector plugins:
Collector config:
Revisions
Upload an updated version of an exported dashboard.json file from Grafana
| Revision | Description | Created | |
|---|---|---|---|
| Download |
Squid
Easily monitor Squid, an open source proxy server, with Grafana Cloud's out-of-the-box monitoring solution.
Learn more