9112 - PowerDNS
Prometheus Powerdns exporter metrics.
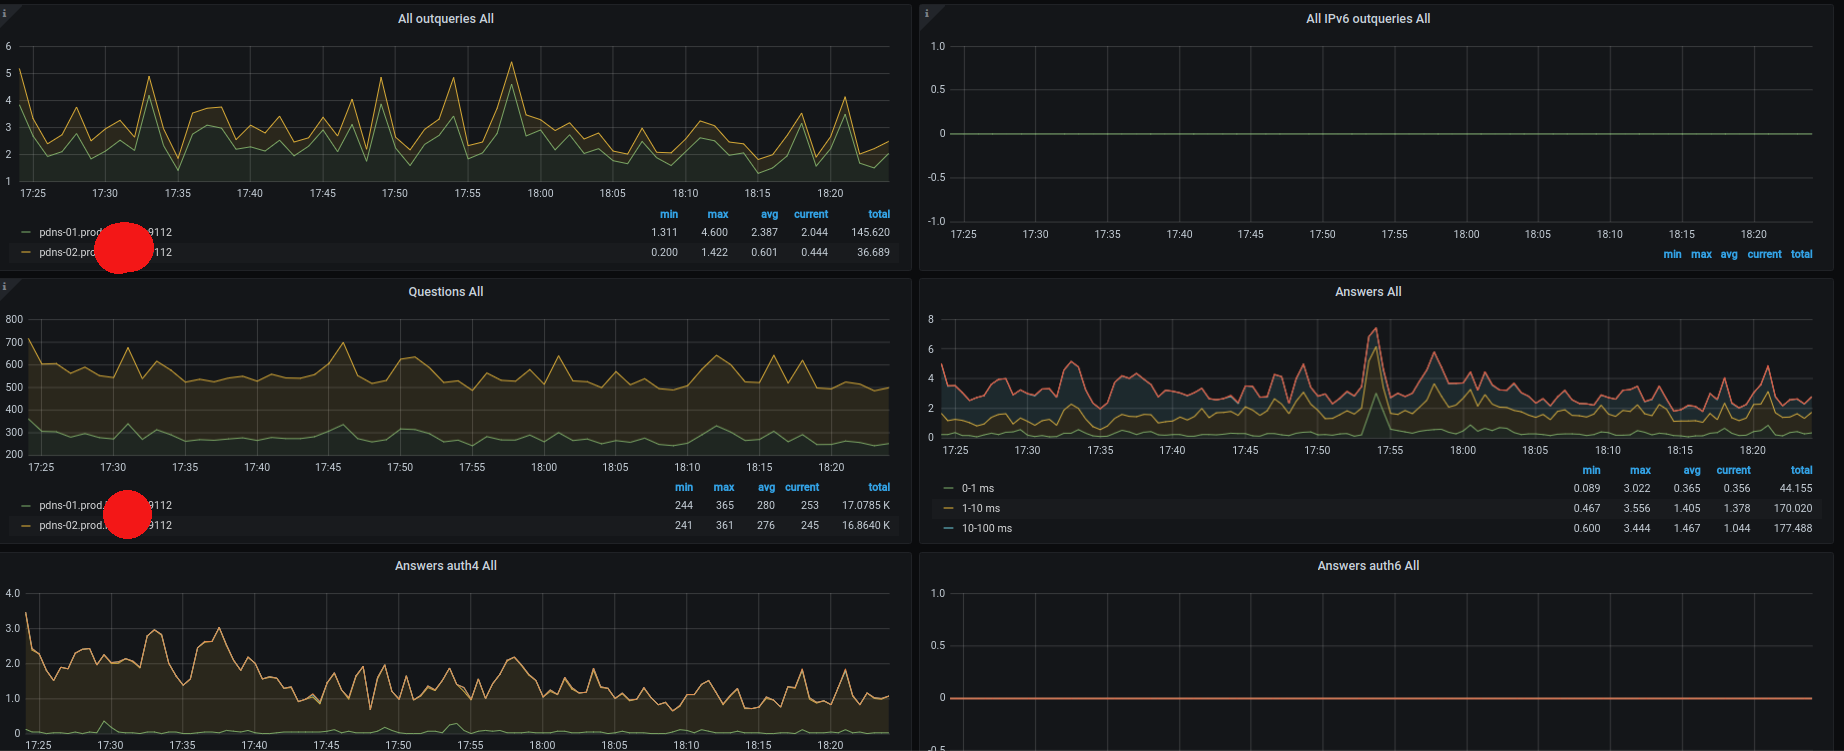
The 9112 - PowerDNS dashboard uses the prometheus data source to create a Grafana dashboard with the graph panel.
Data source config
Collector type:
Collector plugins:
Collector config:
Revisions
Upload an updated version of an exported dashboard.json file from Grafana
| Revision | Description | Created | |
|---|---|---|---|
| Download |