Database Query Metrics
Grafana dashboard showing database metrics exported from Replex dashboards.
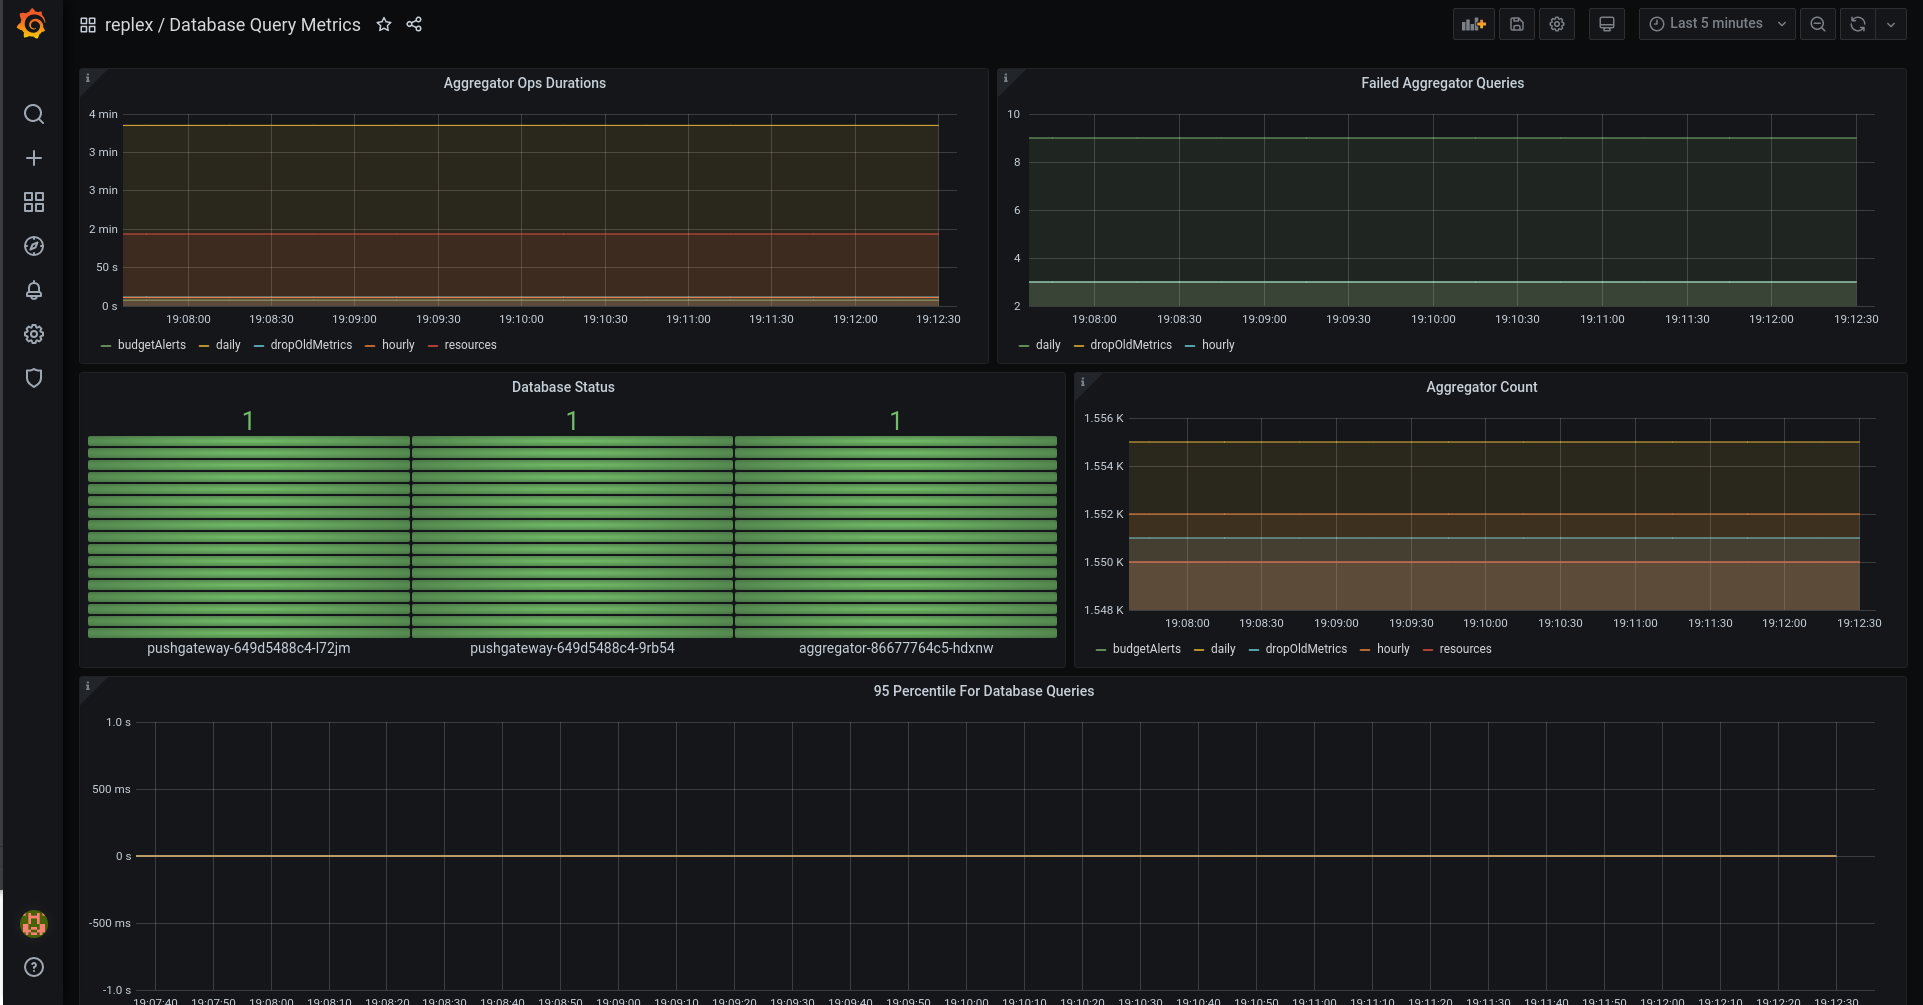
To use this dashboard, you must be running the Replex components which include:
- Aggregator
- Server
- Replex Agent
- Pushgateway
For more details, check out https://www.replex.io/technology
Data source config
Collector type:
Collector plugins:
Collector config:
Revisions
Upload an updated version of an exported dashboard.json file from Grafana
| Revision | Description | Created | |
|---|---|---|---|
| Download |