OpenLDAP Status
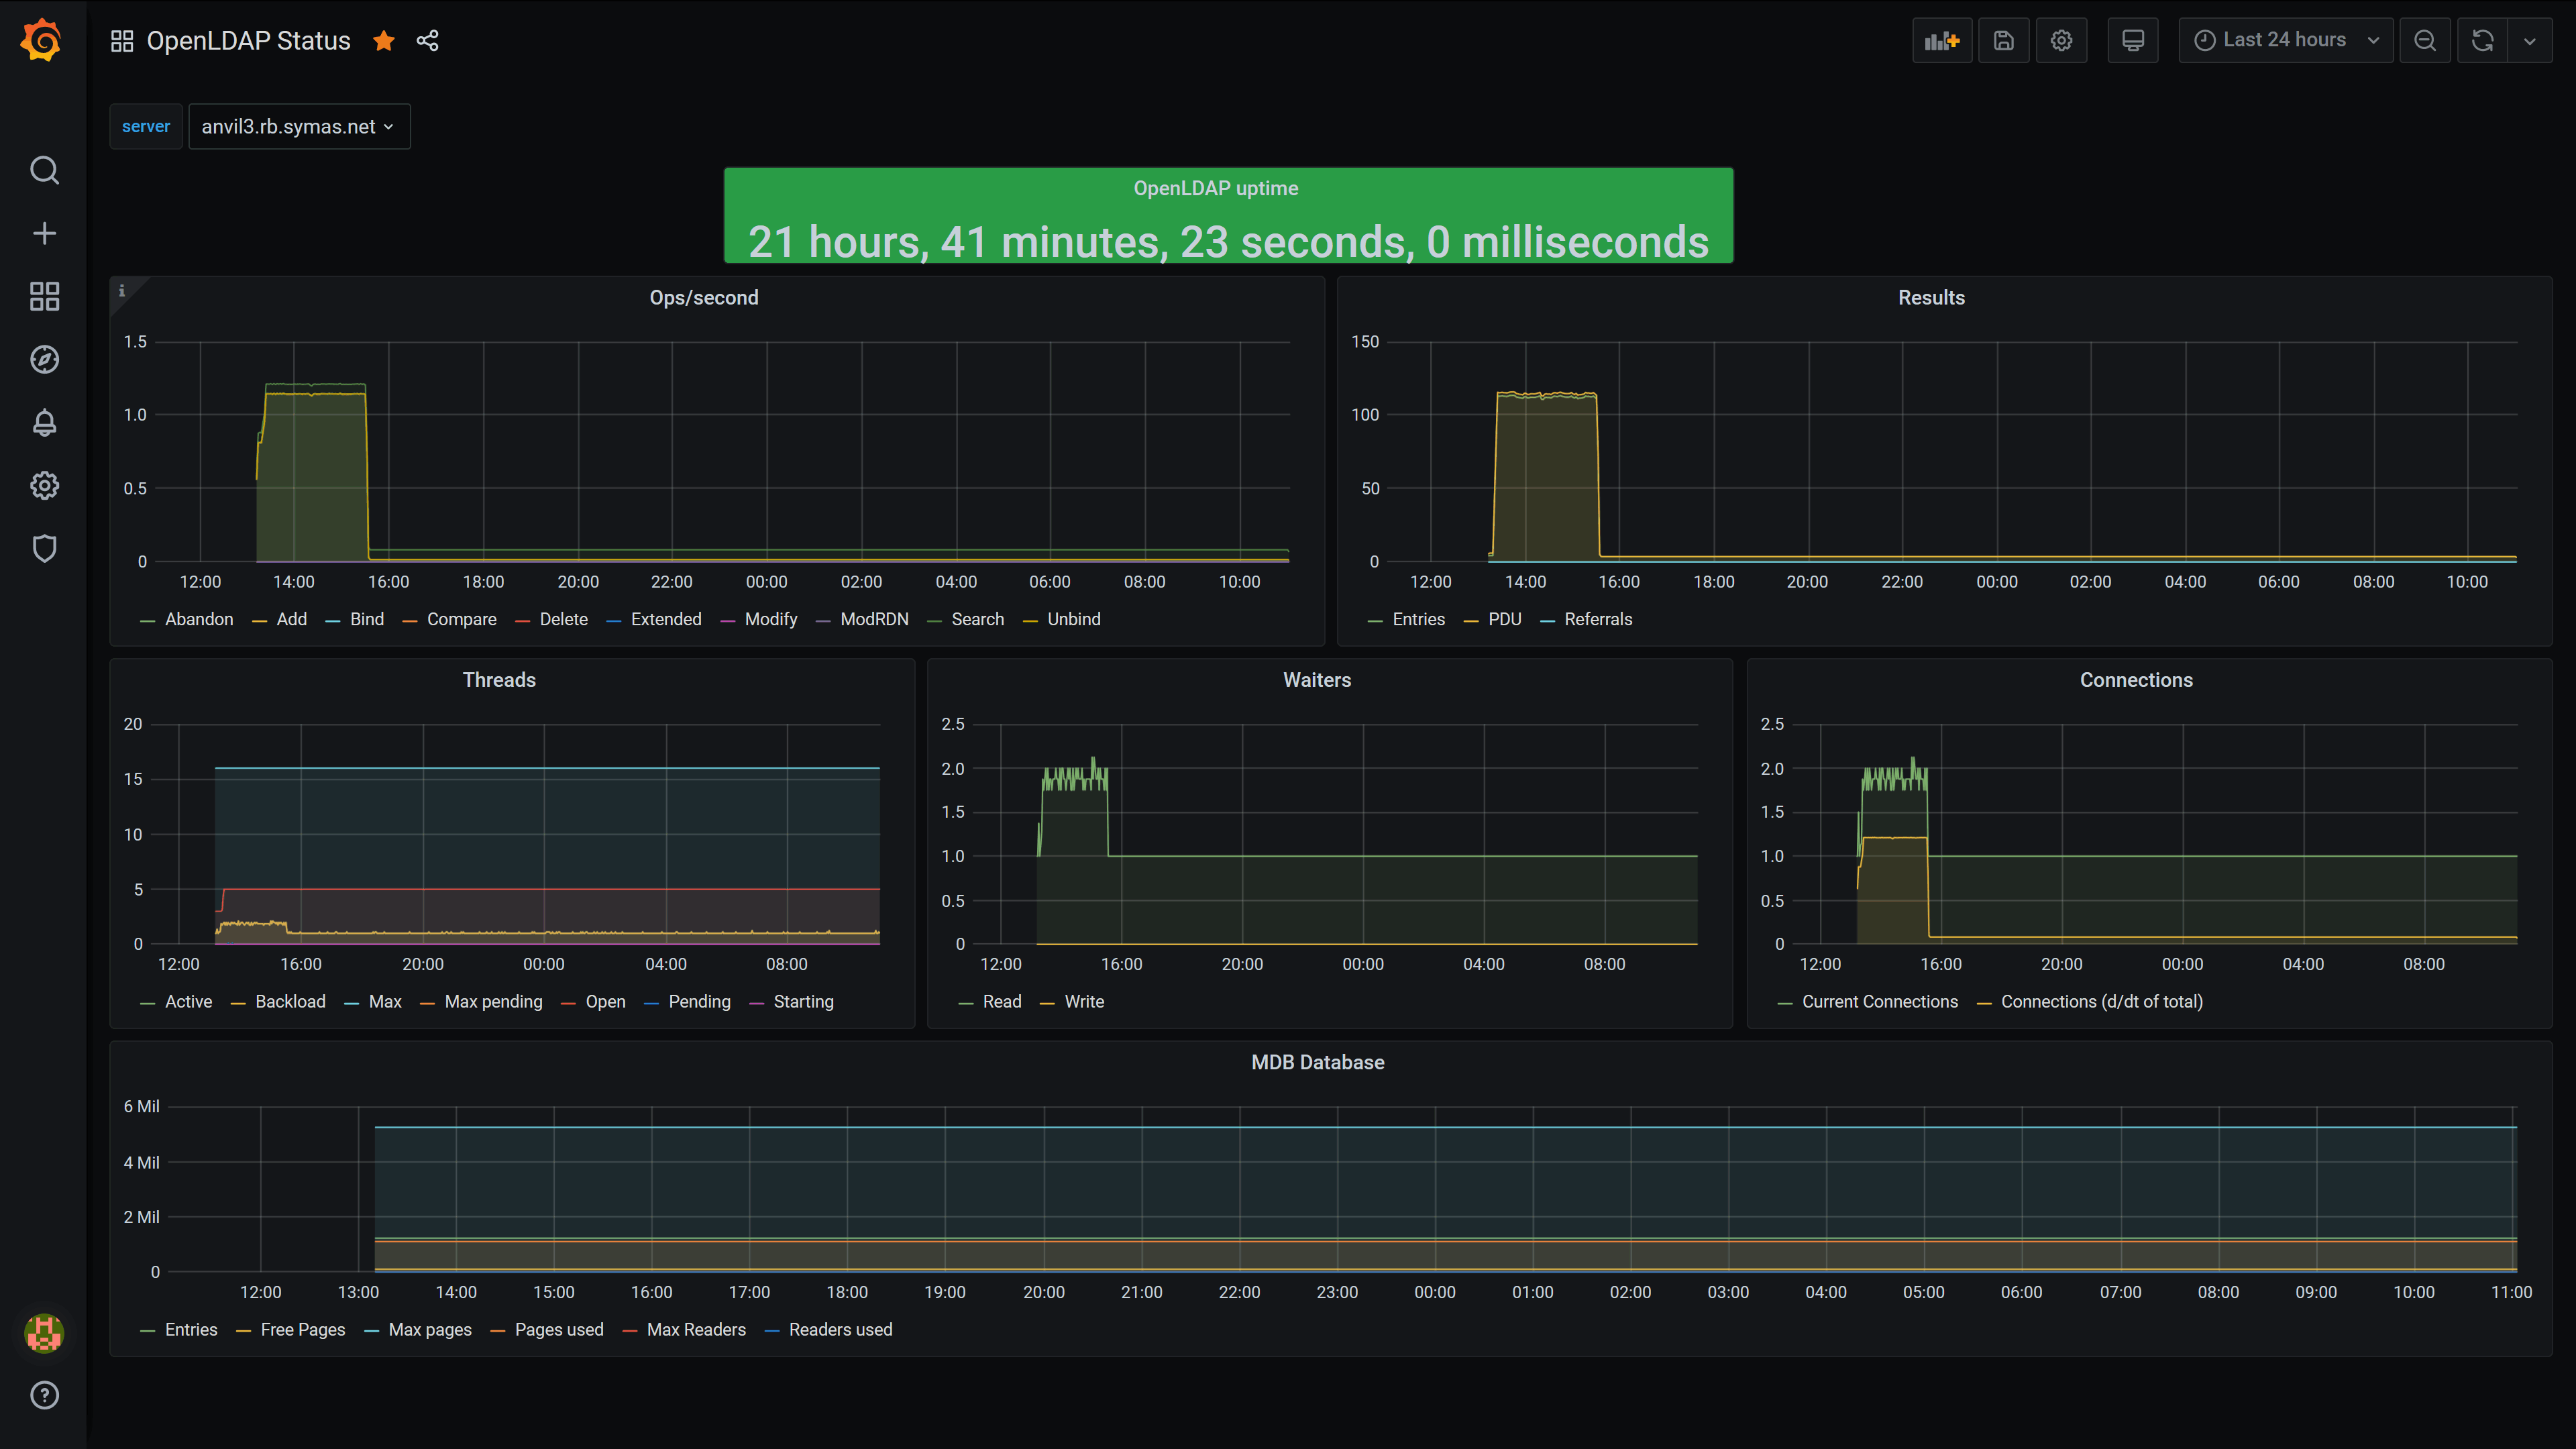
Per server data from OpenLDAP monitor backend.
This dashboard gathers statistics for OpenLDAP from the monitor backend. Usage requires the openldap input in telegraf and the ability for telegraf to have read access to the monitor db. It is necessary to set reverse_metric_names=true for the input.
Example config:
[[inputs.openldap]]
host="localhost"
port=389
tls=""
reverse_metric_names=true
It is important to note that the MDB portion of the dashboard assumes that the MDB database is the first database in the configuration (I.e., olcDatabase={1}mdb). If that is not the database to be monitored, the MDB dashboard will need to be adjusted accordingly.
Data source config
Collector config:
Upload an updated version of an exported dashboard.json file from Grafana
| Revision | Description | Created | |
|---|---|---|---|
| Download |
OpenLDAP
Easily monitor OpenLDAP, an open source LDAP implementation, with Grafana Cloud's out-of-the-box monitoring solution.
Learn more