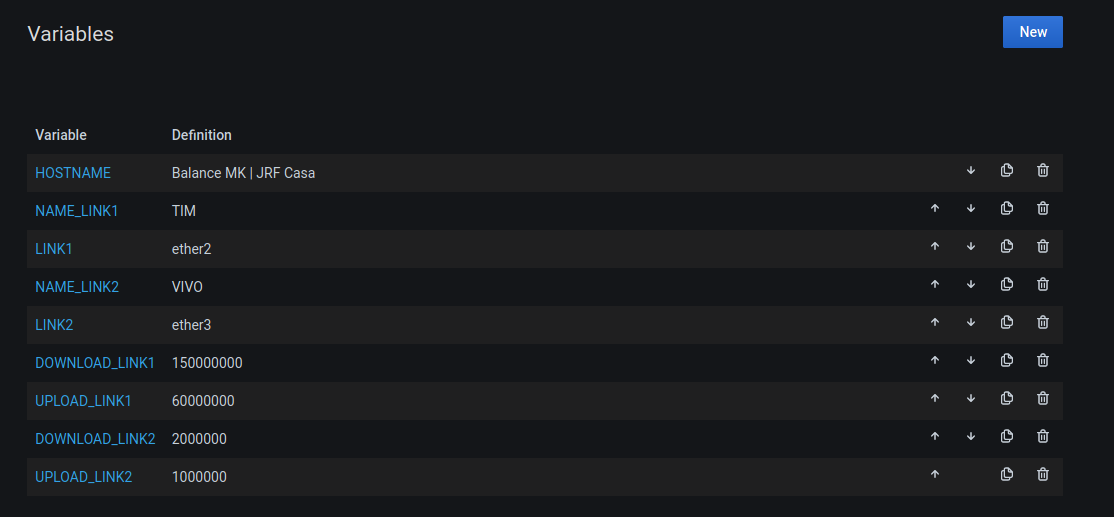
Monitoramento de balance Mikrotik - SNMP
Mede o consumo real do tráfego de internet por SNMP
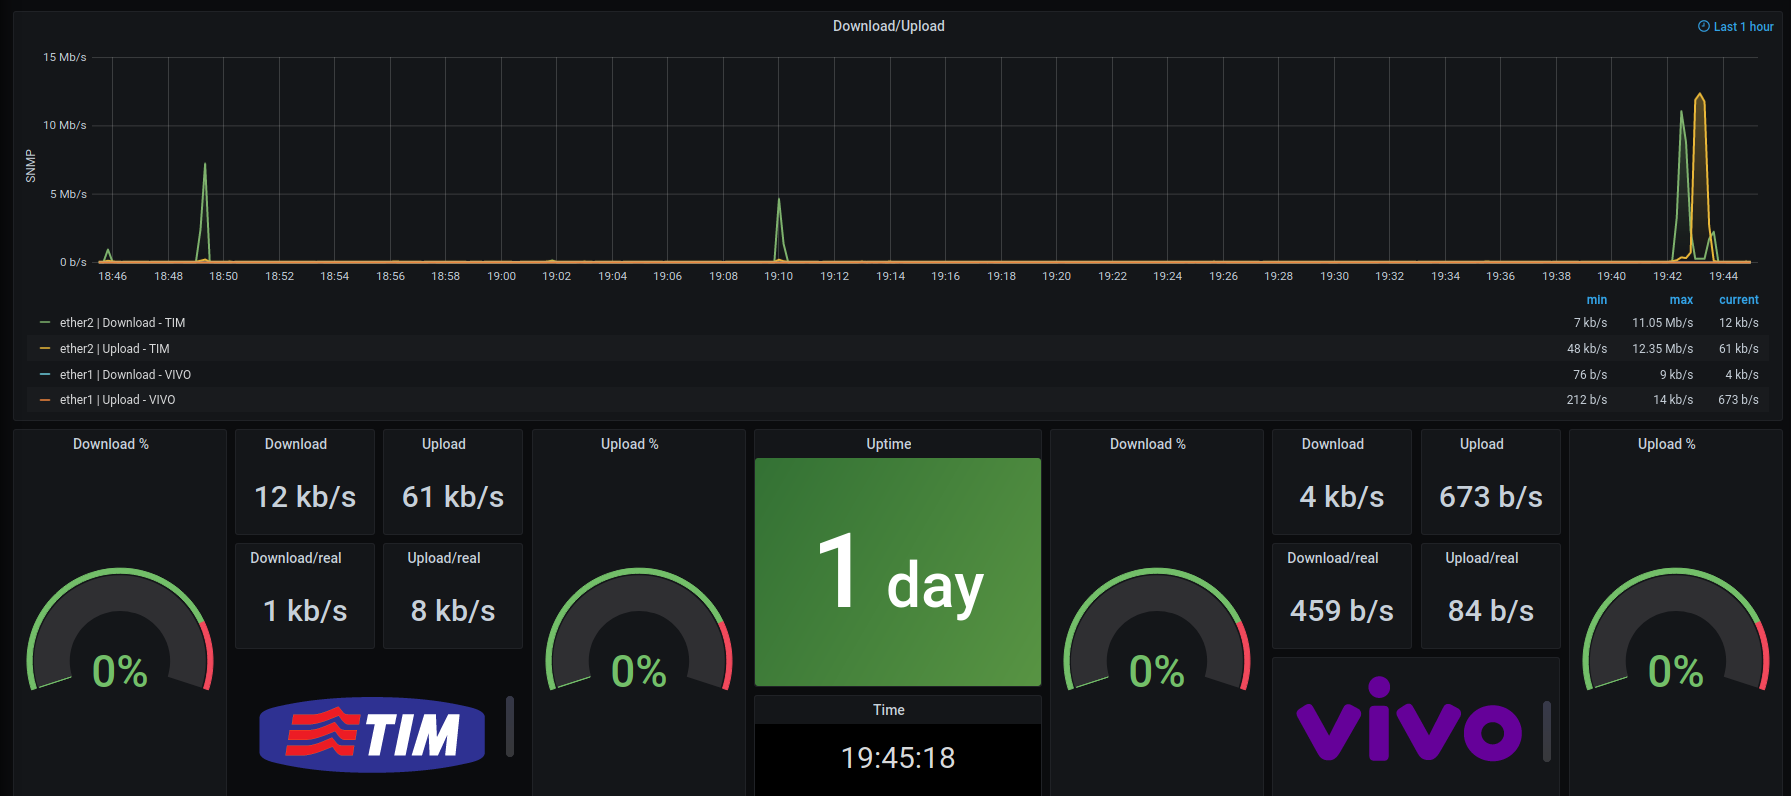
The Monitoramento de balance Mikrotik - SNMP dashboard uses the influxdb data source to create a Grafana dashboard with the gauge, grafana-clock-panel, graph, singlestat, stat and text panels.
Data source config
Collector type:
Collector plugins:
Collector config:
Revisions
Upload an updated version of an exported dashboard.json file from Grafana
| Revision | Description | Created | |
|---|---|---|---|
| Download |
SNMP
Easily monitor any generic SNMP (Simple Network Management Protocol) device with Grafana Cloud's out-of-the-box monitoring solution.
Learn more