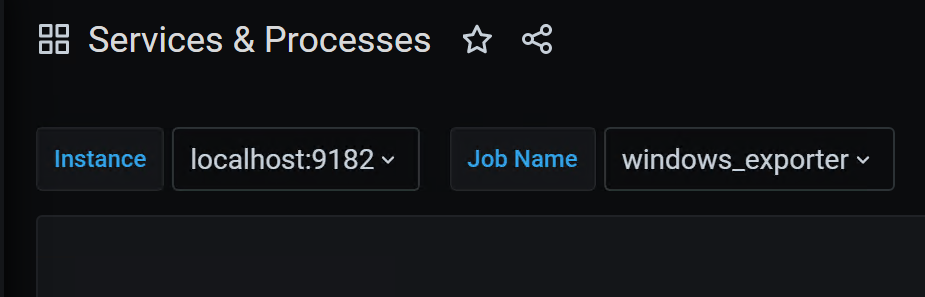
Windows Services & Processes
History of service statuses & process metrics
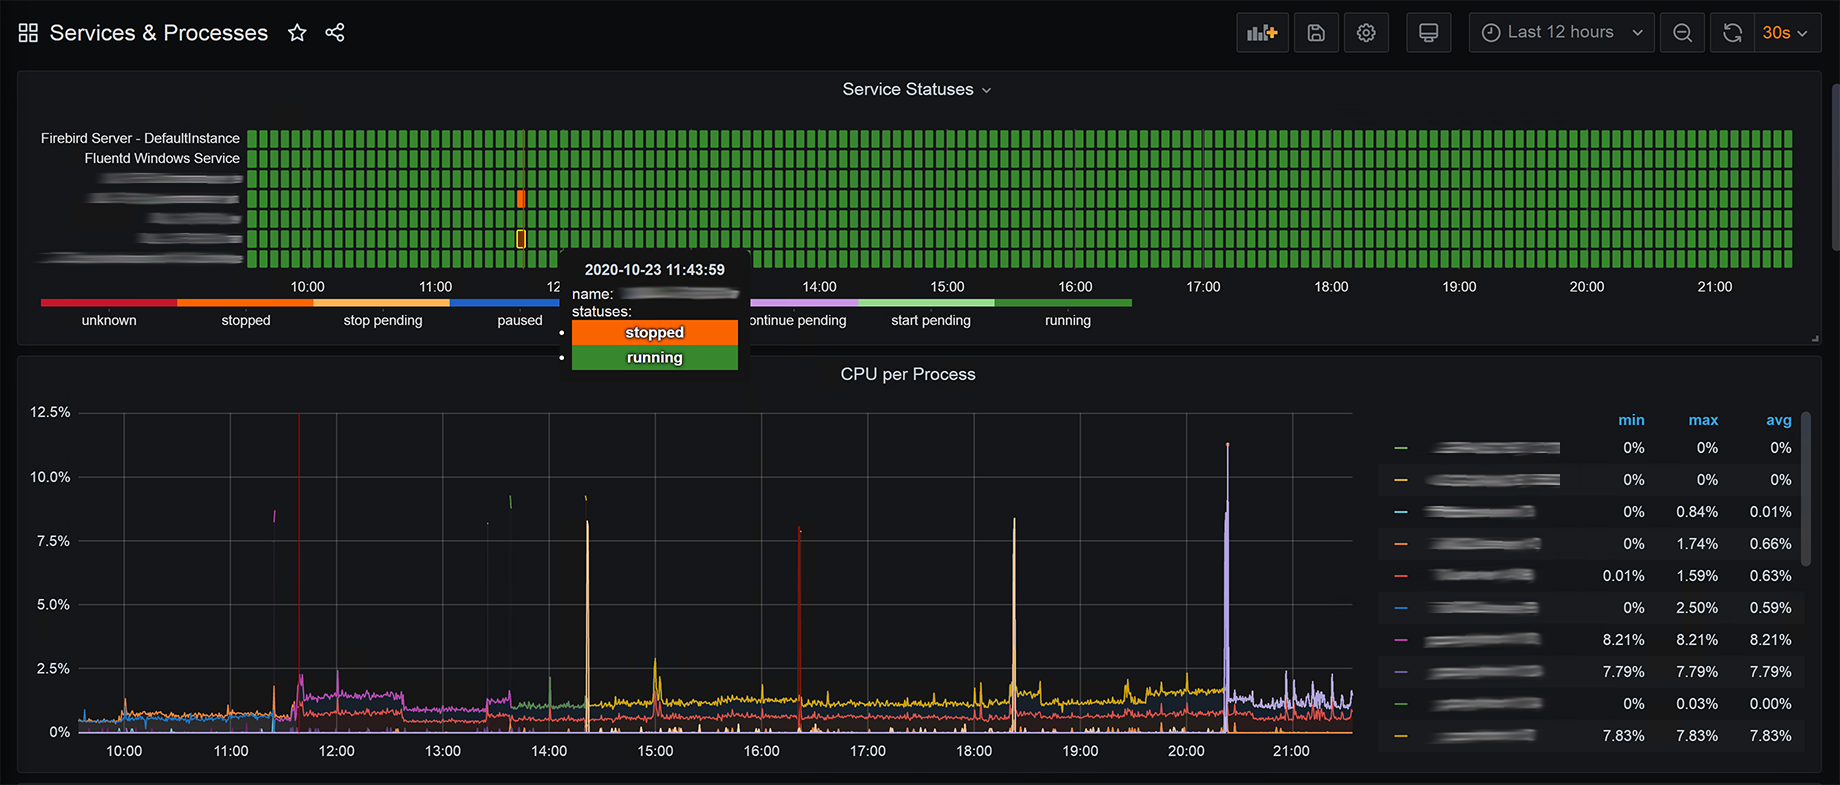
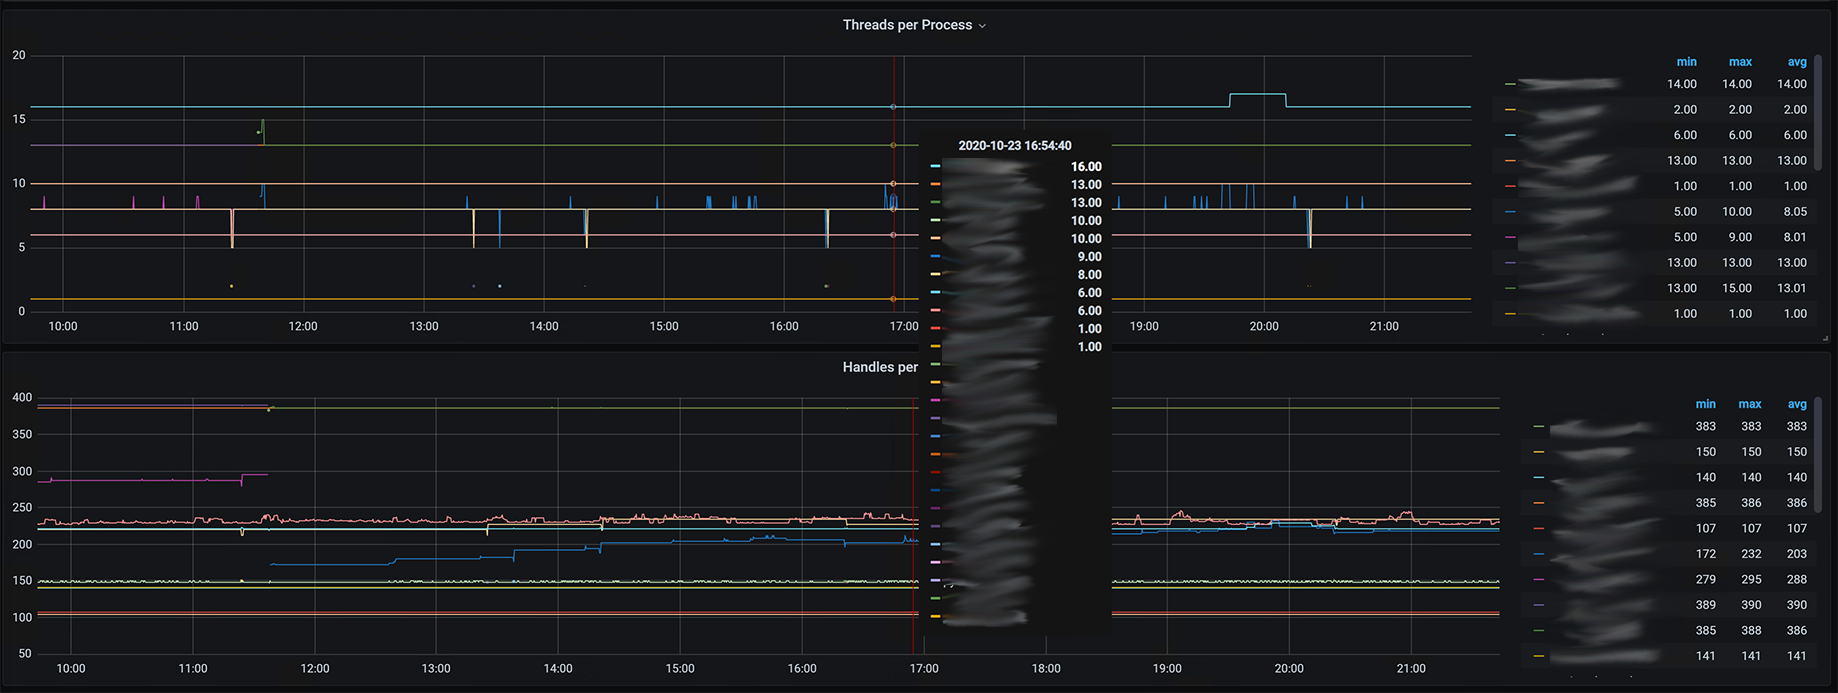
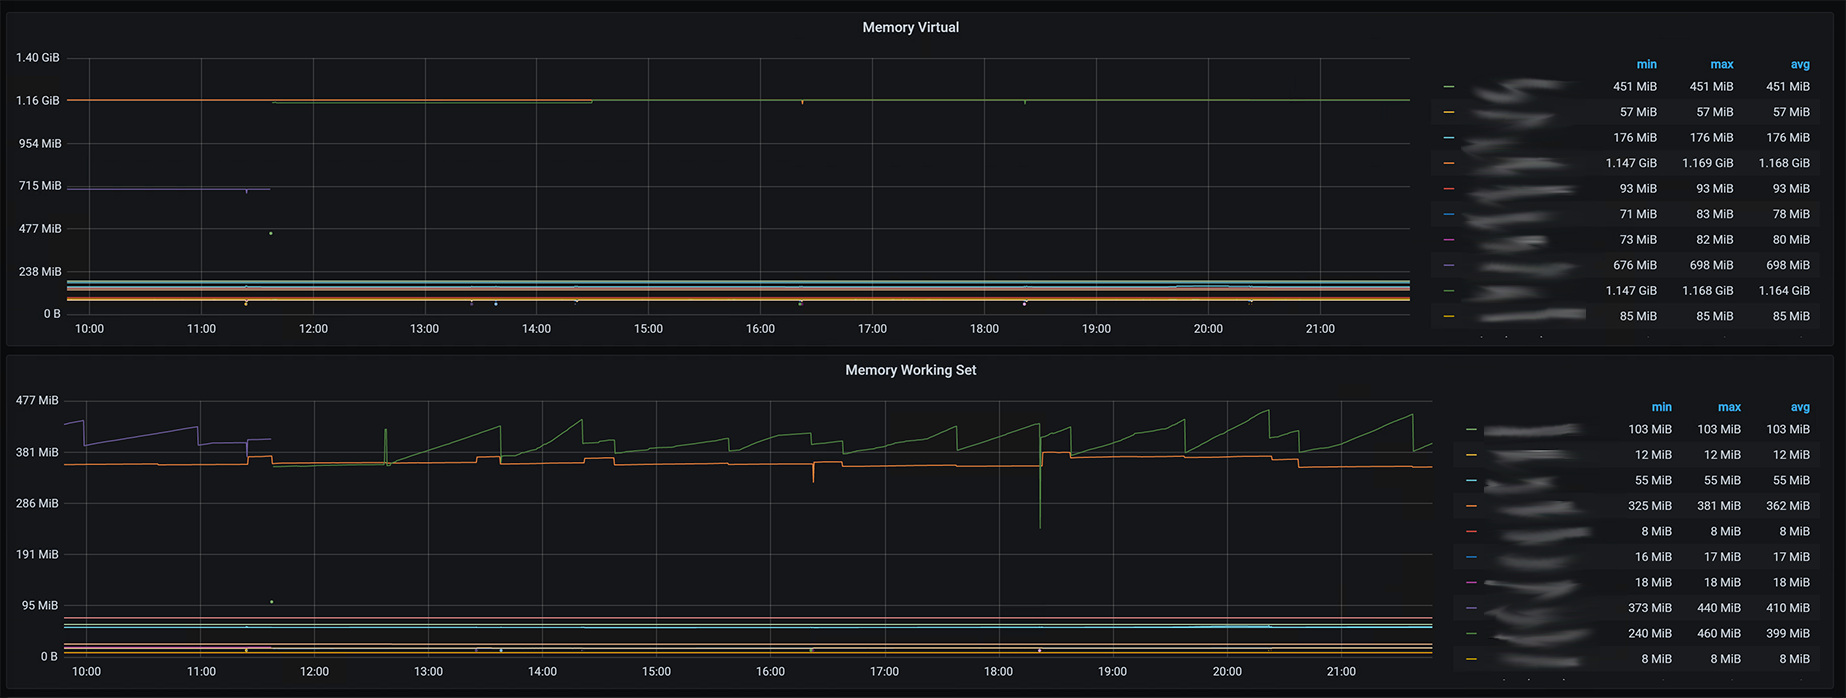
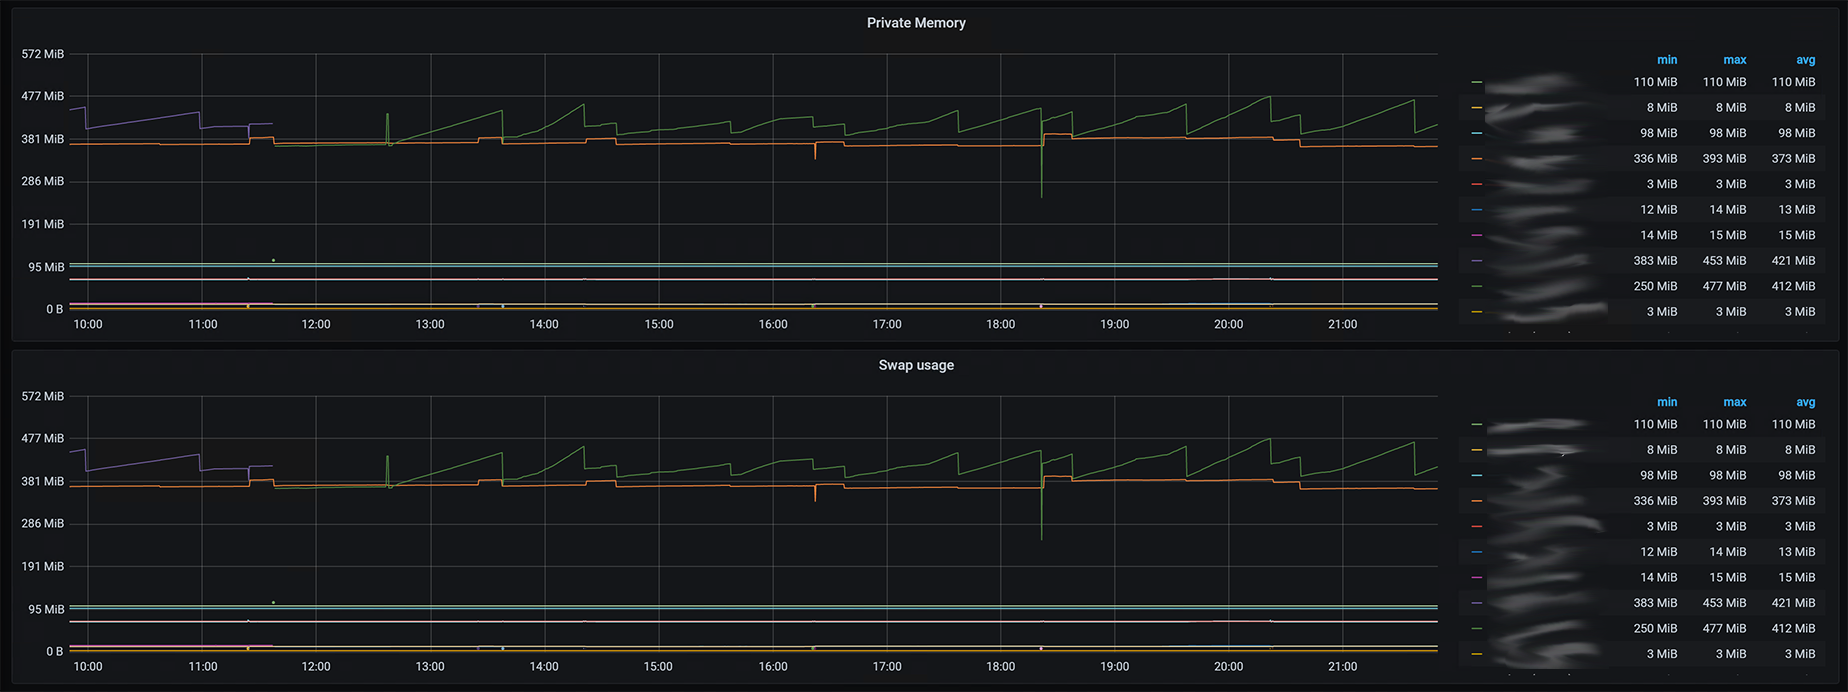
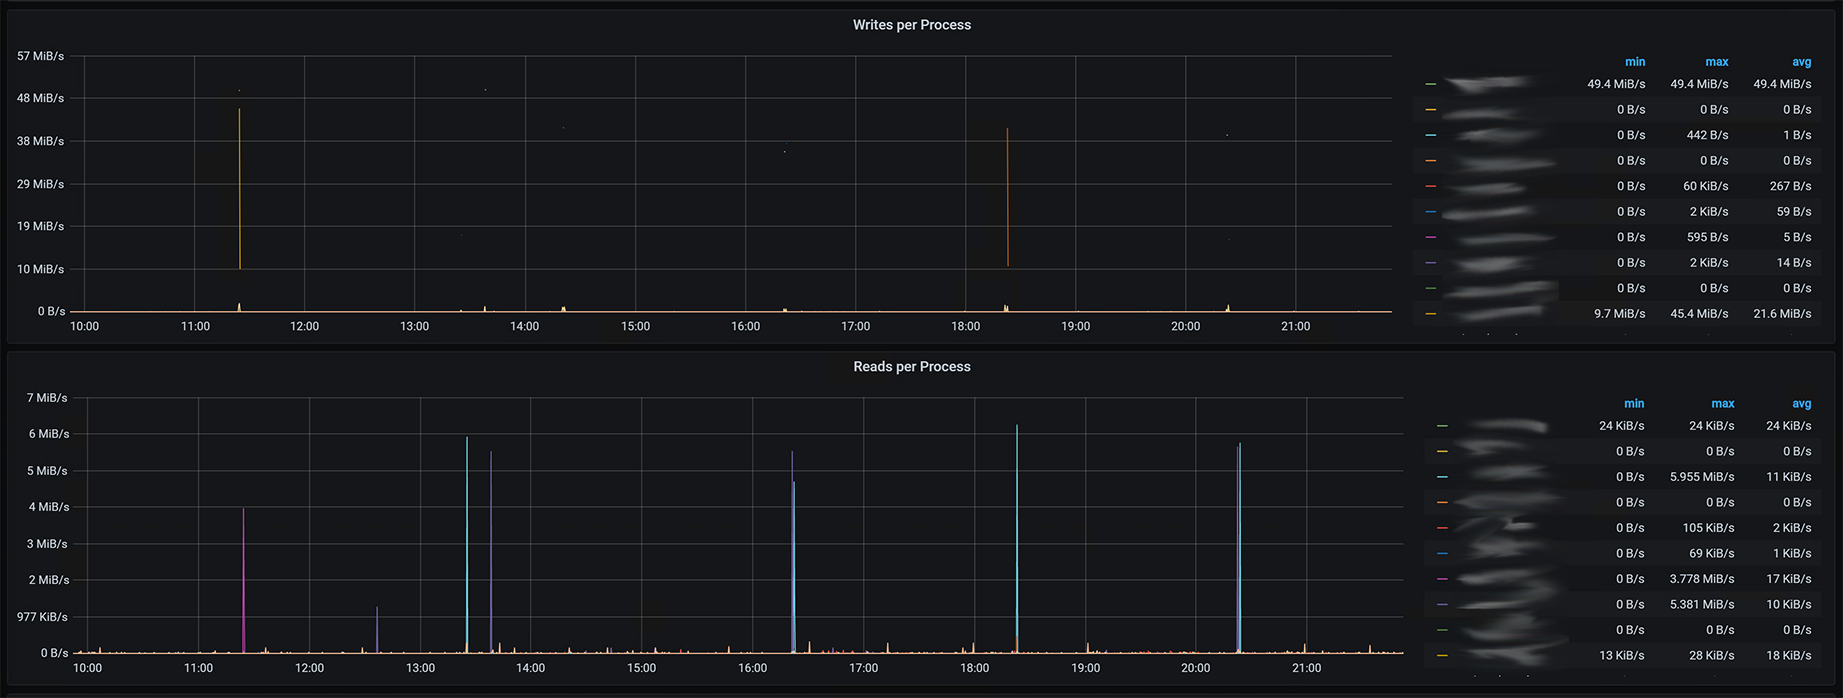
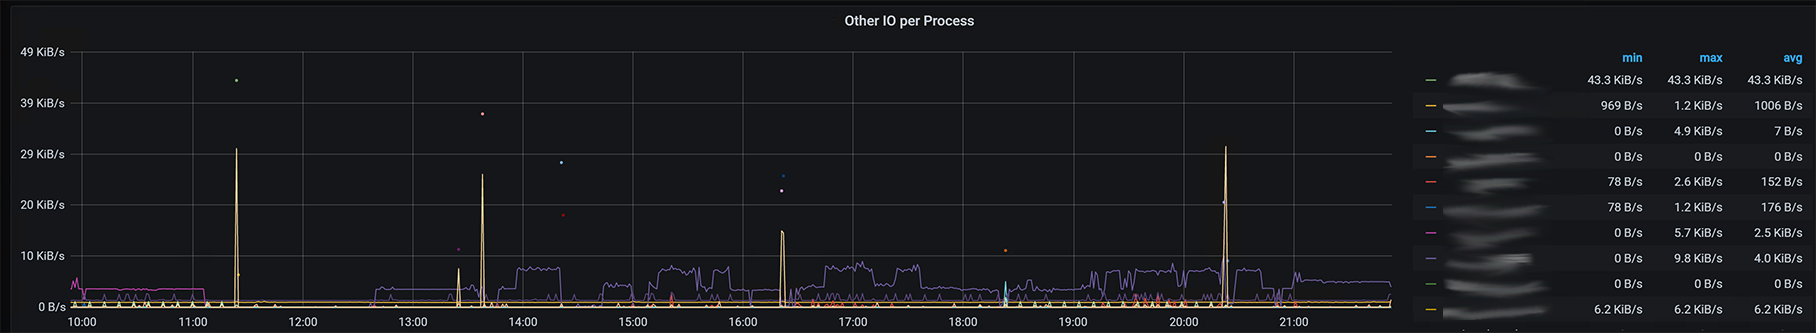
The dashboard provides a history of statuses of services and process-related metrics.
Prometheus is used as the data source, which stores data collected from "windows_exporter".
Collectors of "windows_exporter" used:
serviceprocesssystem
Depends on the "Statusmap" plugin.
It is recommended to filter out lists of services/processes either in the config of "windows_exporter" or manually in the dashboard.
See also: "System Overview" dashboard 13261 (https://grafana.com/grafana/dashboards/13261).
Data source config
Collector type:
Collector plugins:
Collector config:
Revisions
Upload an updated version of an exported dashboard.json file from Grafana
| Revision | Description | Created | |
|---|---|---|---|
| Download |
Windows
Easily monitor your deployment of the Windows operating system with Grafana Cloud's out-of-the-box monitoring solution.
Learn more