IPMI for Prometheus
Charts from ipmitool in node exporter
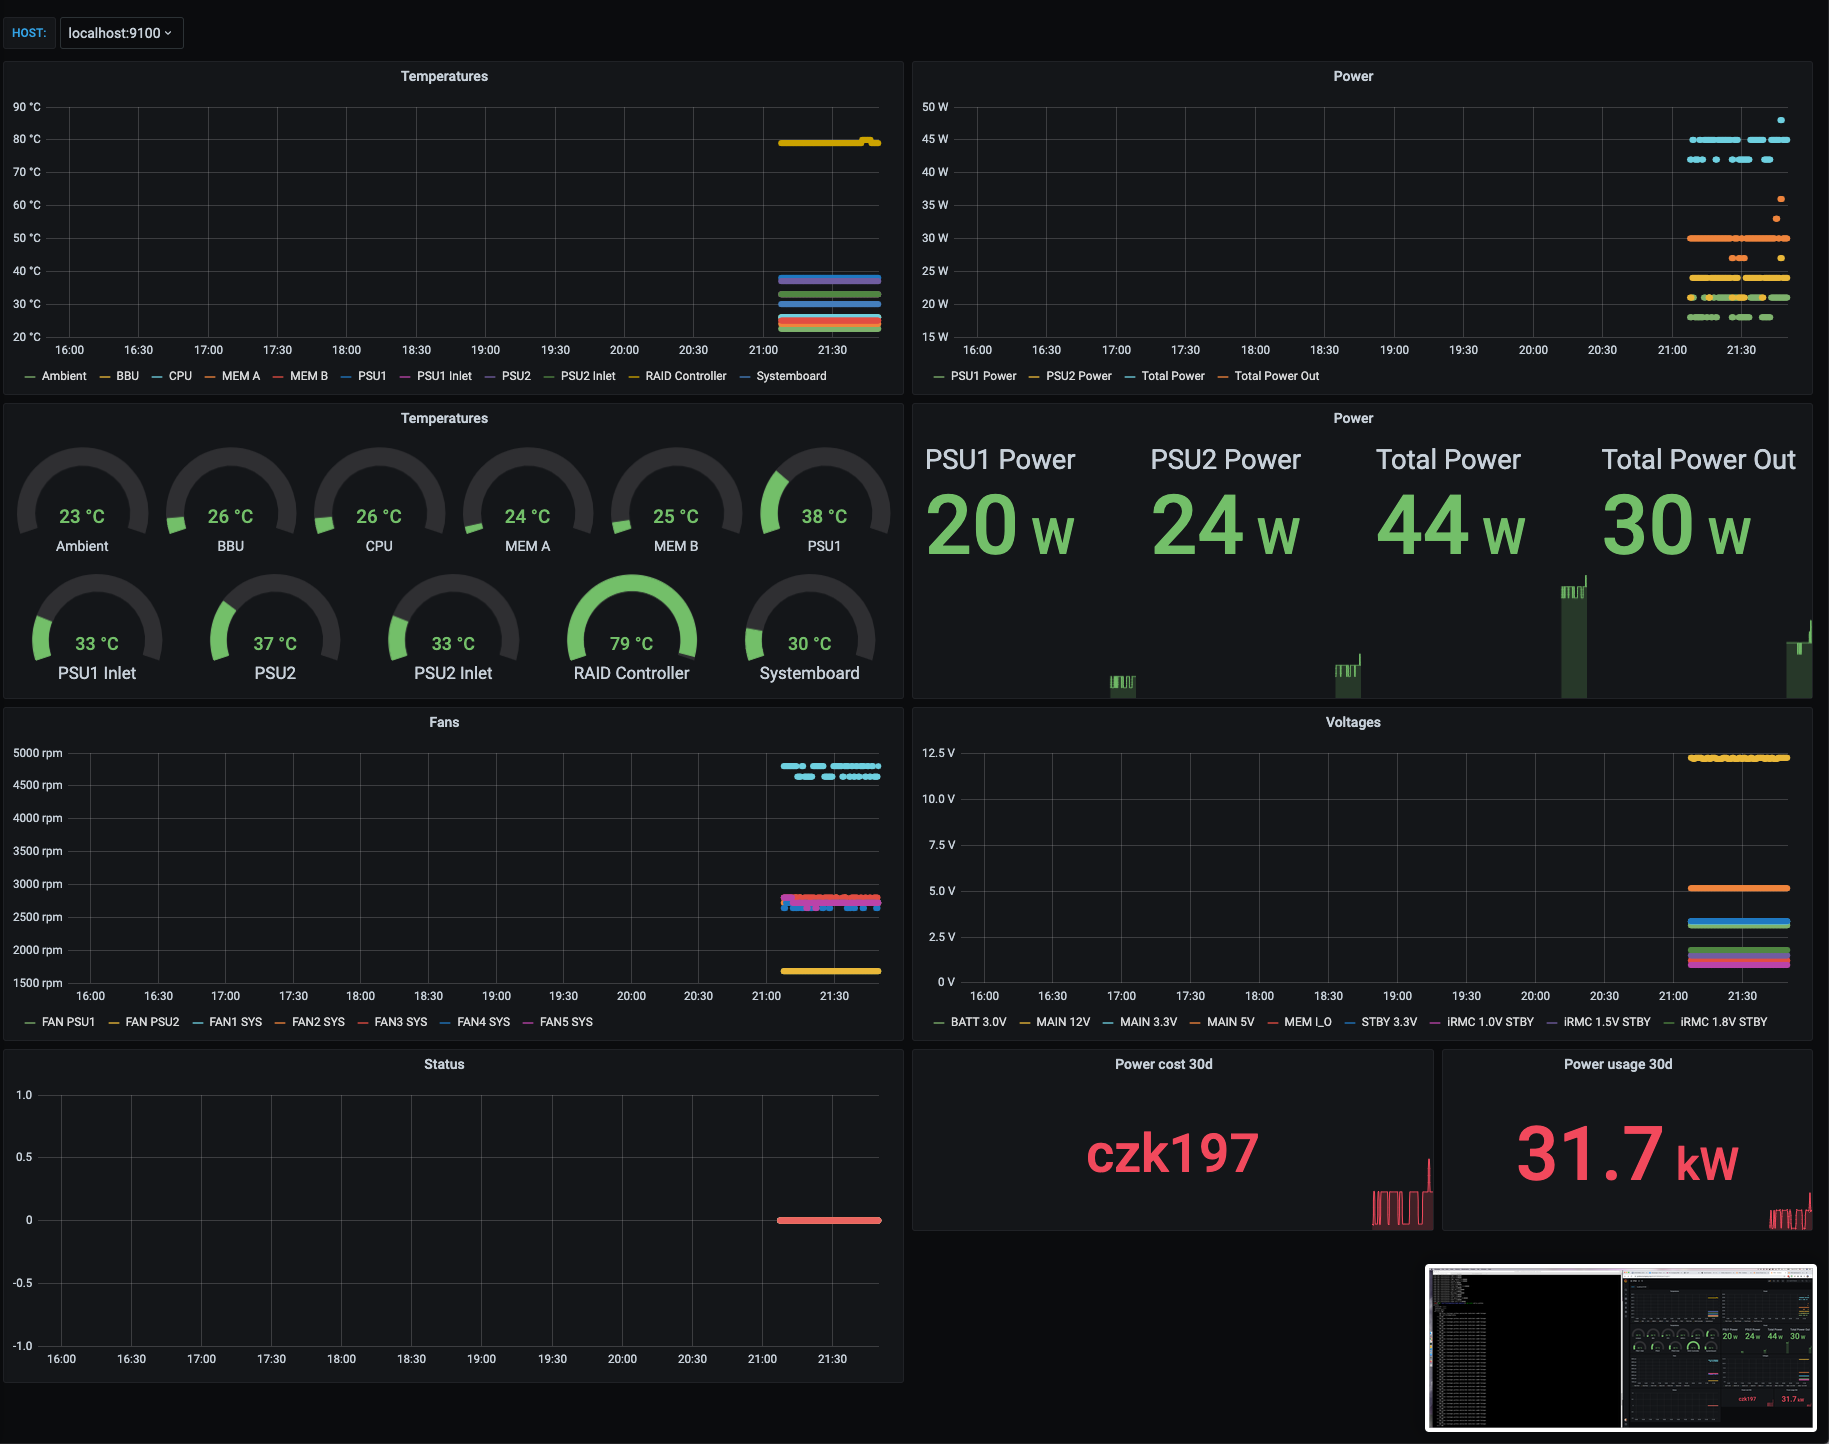
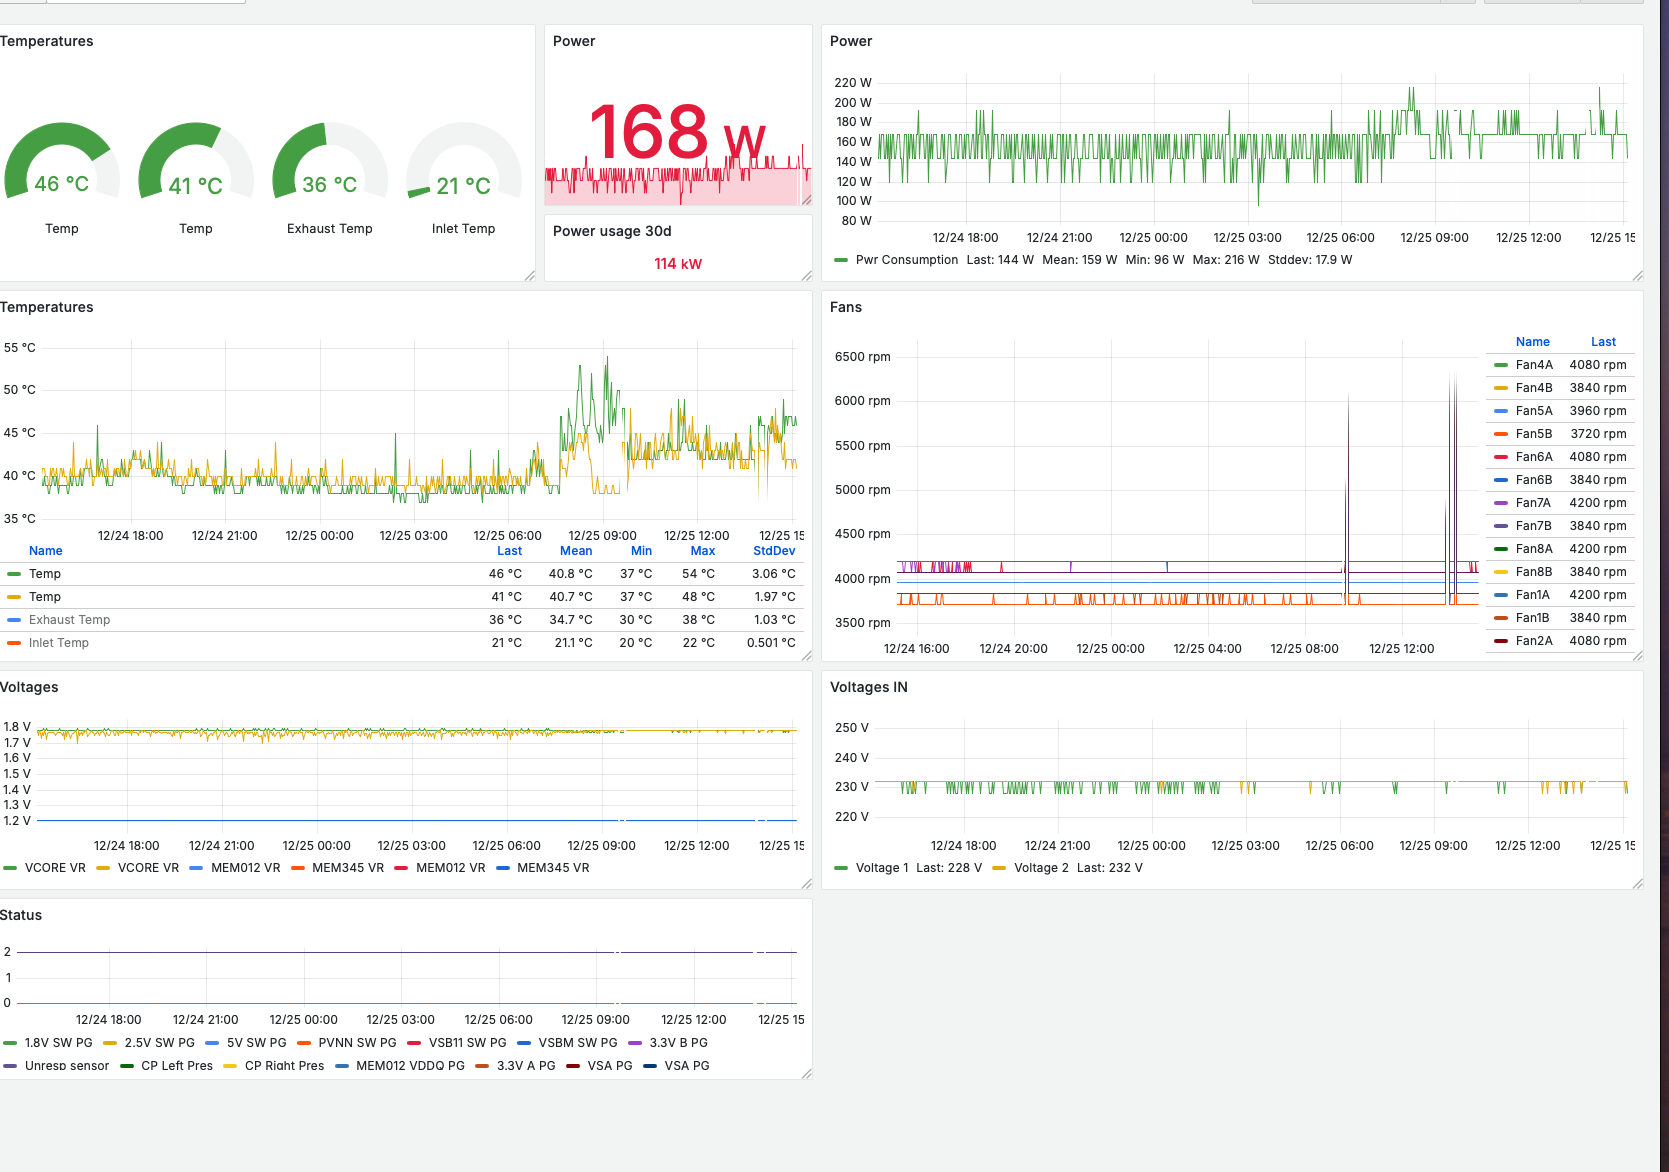
Shows metrics from node-exporter with ipmitool text plugin.
Modify Power cost for a basic monthly power cost calculator. (old version only)
Update: works with ipmi_exporter too.
Data source config
Collector type:
Collector plugins:
Collector config:
Revisions
Upload an updated version of an exported dashboard.json file from Grafana
| Revision | Description | Created | |
|---|---|---|---|
| Download |
Metrics Endpoint (Prometheus)
Easily monitor any Prometheus-compatible and publicly accessible metrics URL with Grafana Cloud's out-of-the-box monitoring solution.
Learn more