MPDV Services - Service details
Overview of the details of called services (number, duration, aborts, number of records)
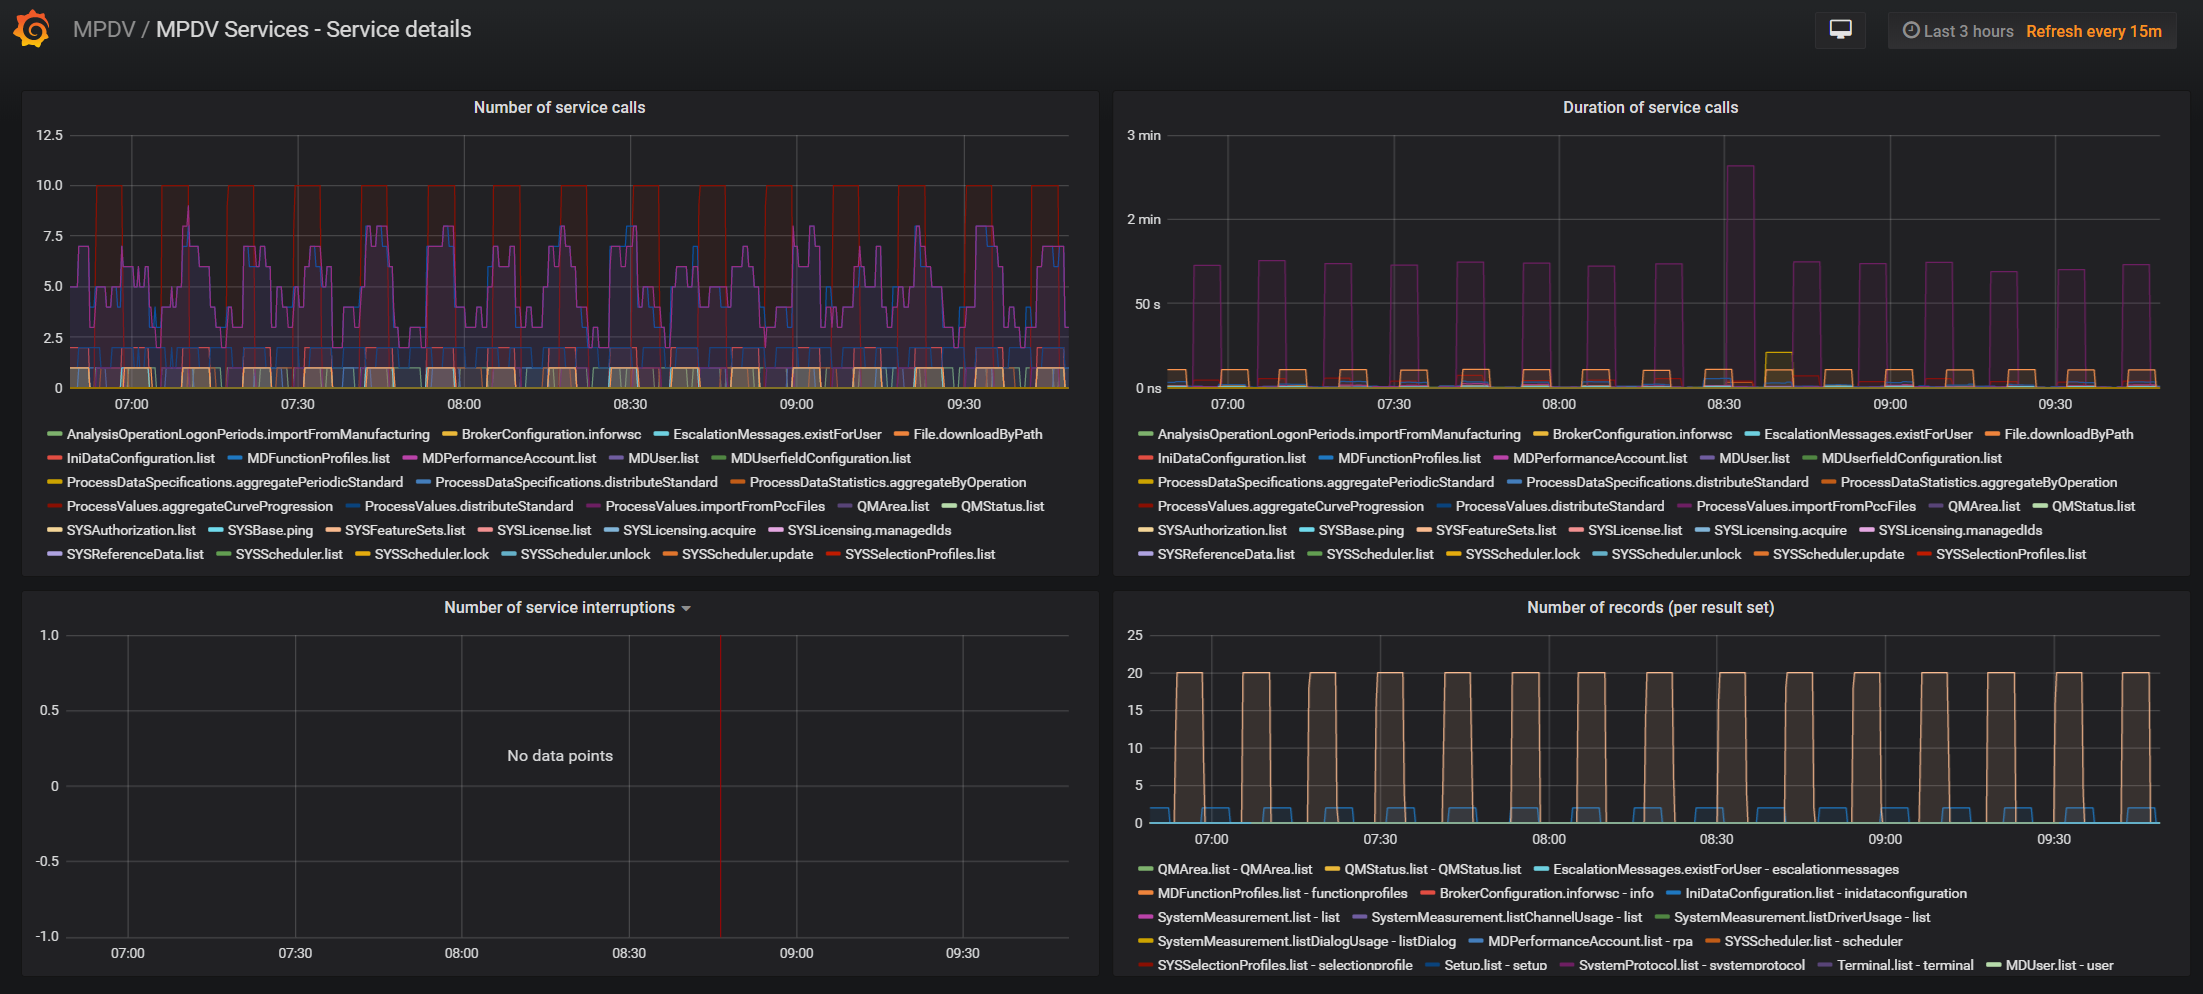
The MPDV Services - Service details dashboard uses the prometheus data source to create a Grafana dashboard with the graph panel.
Data source config
Collector type:
Collector plugins:
Collector config:
Revisions
Upload an updated version of an exported dashboard.json file from Grafana
| Revision | Description | Created | |
|---|---|---|---|
| Download |