HAProxy Instance Summary (Designed for PMM)
This dashboard displays the detailed HAProxy information of sections and backend servers.
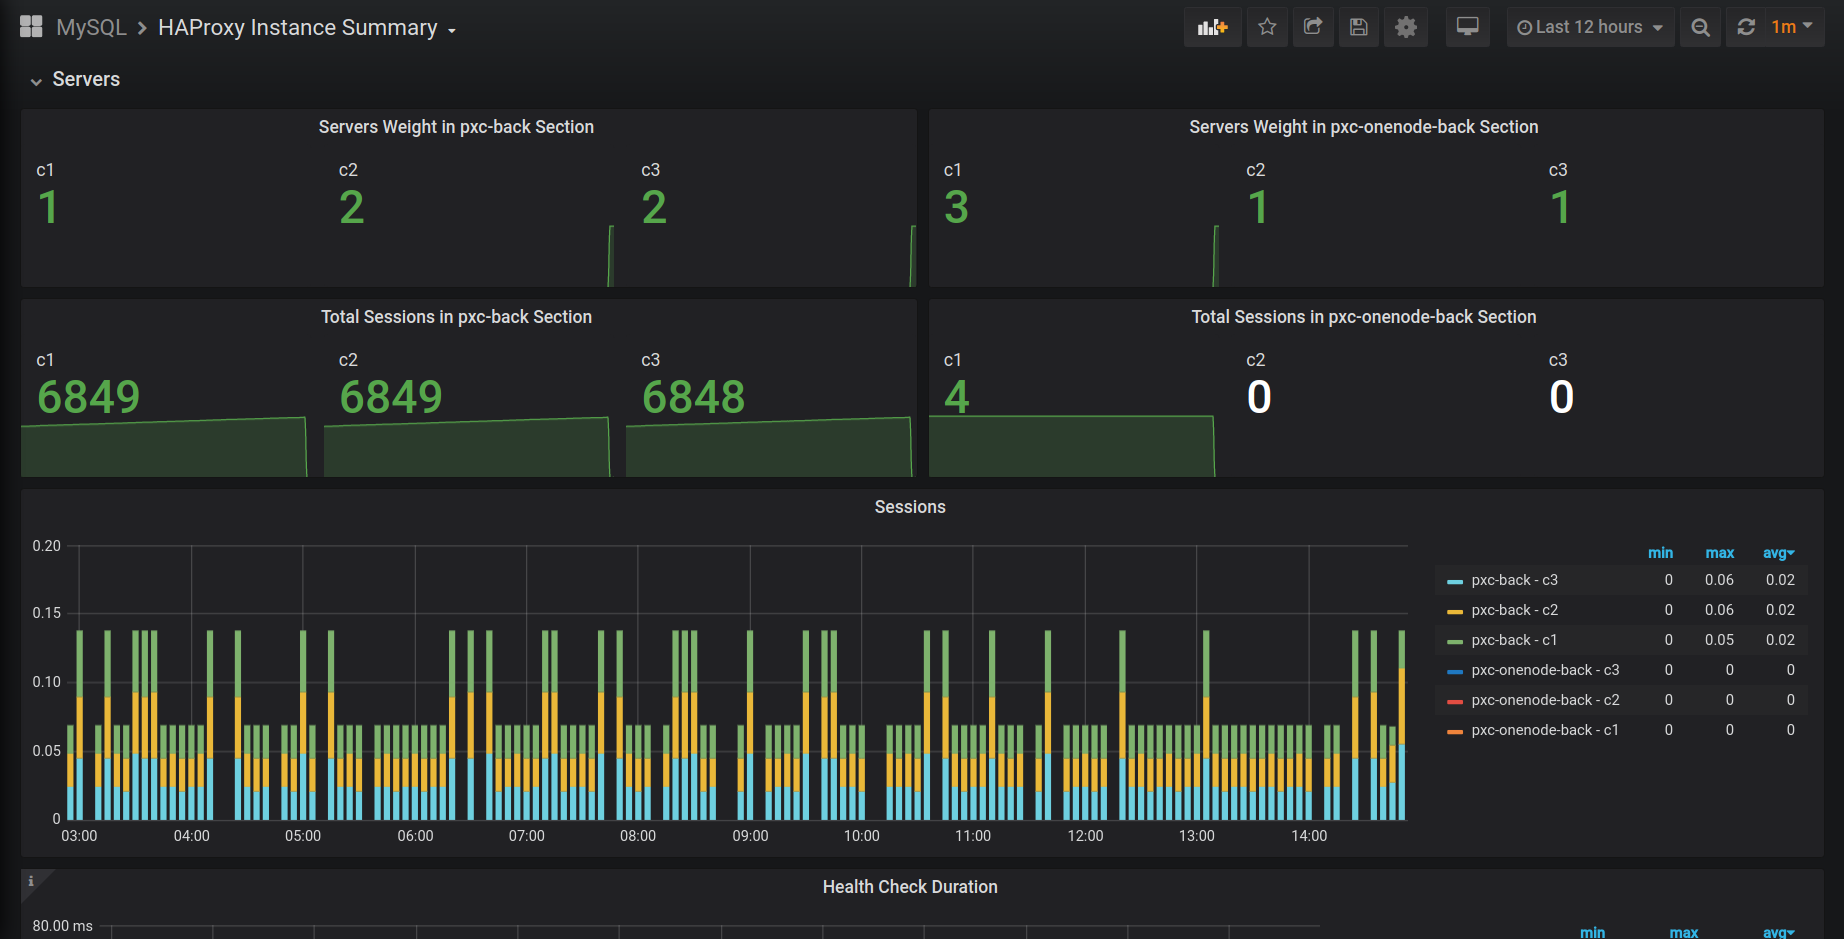
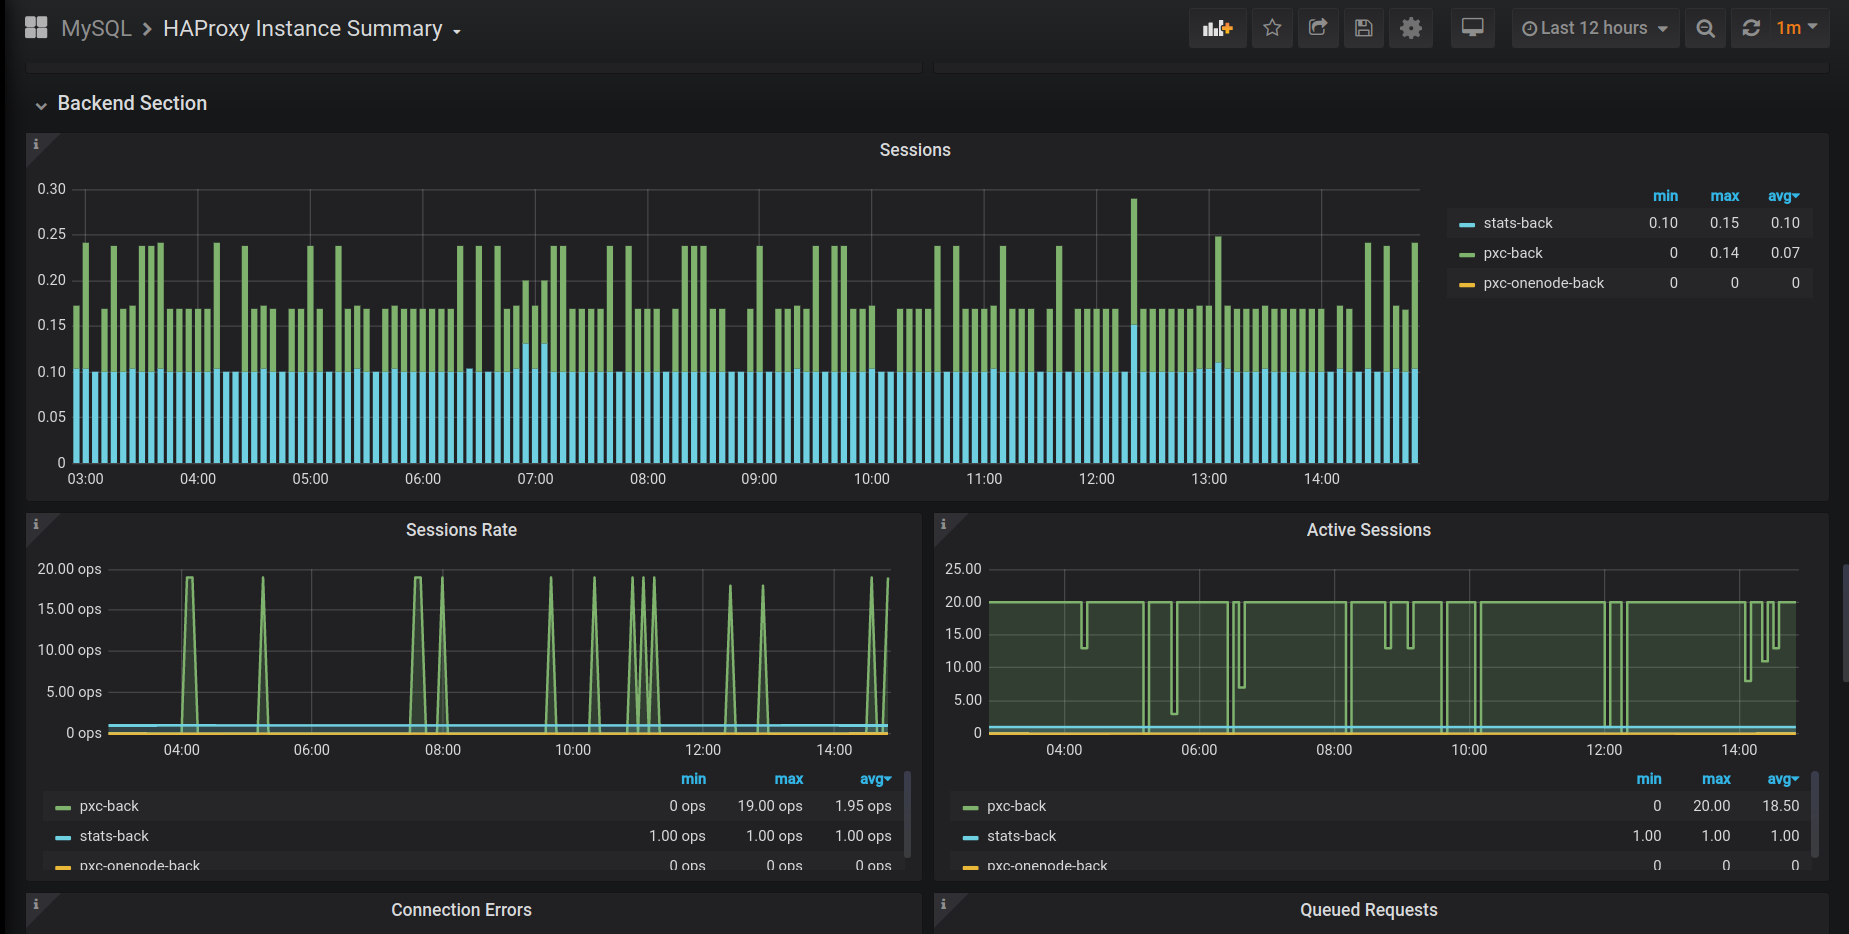
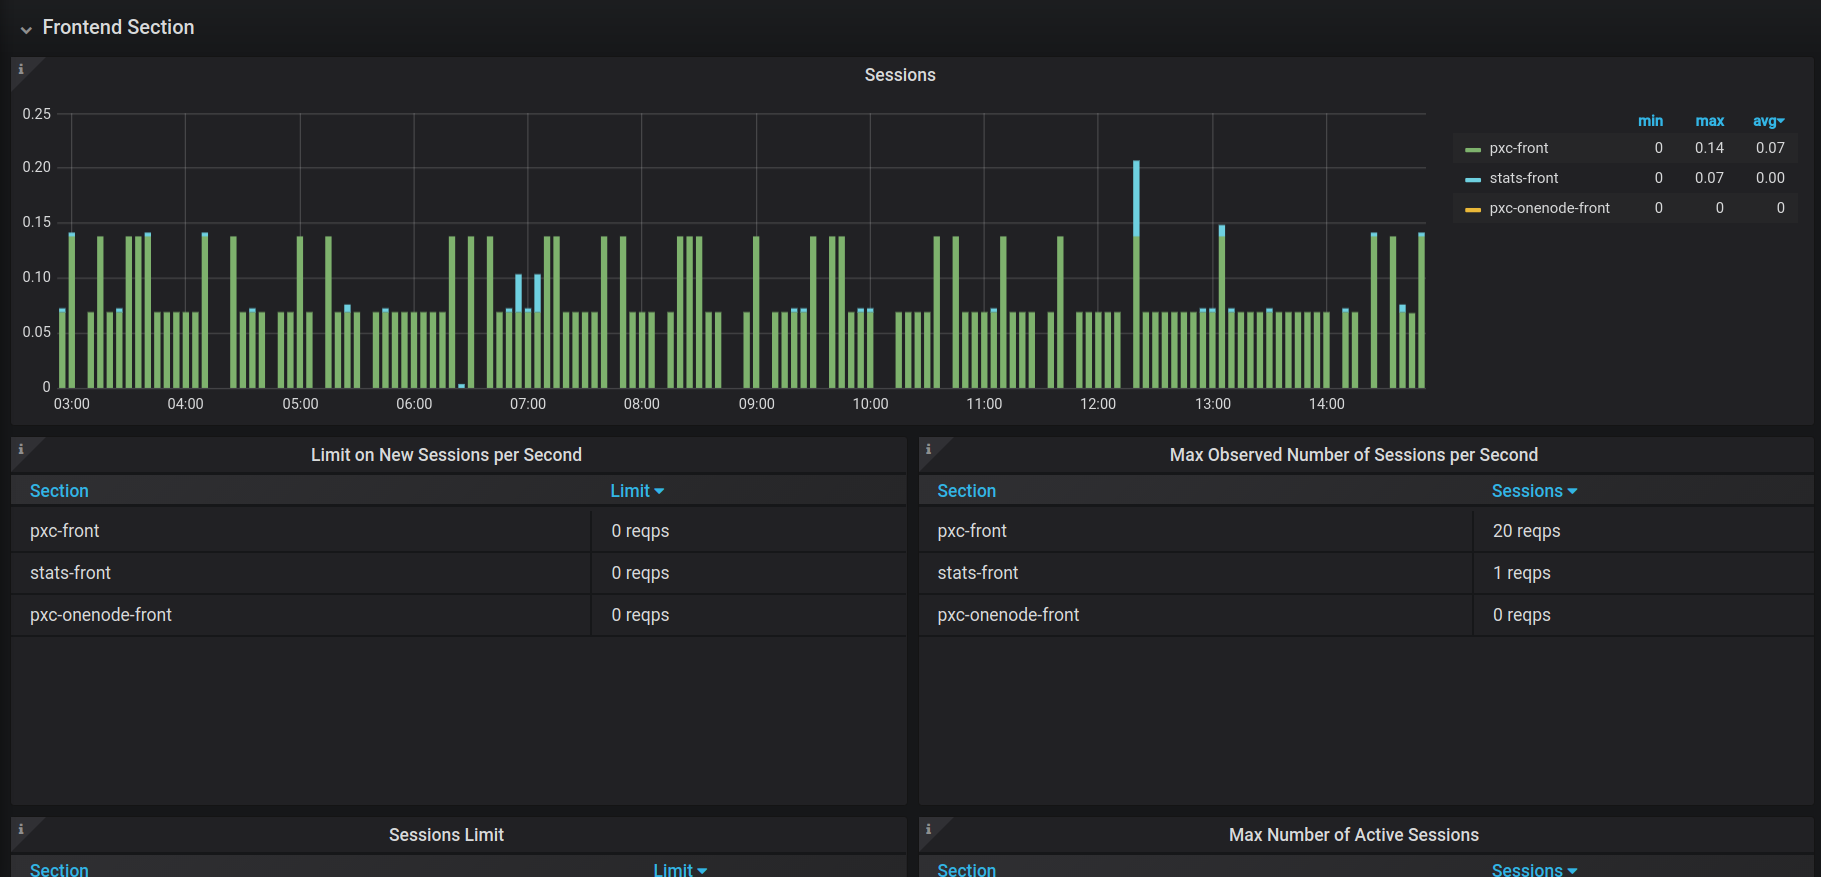
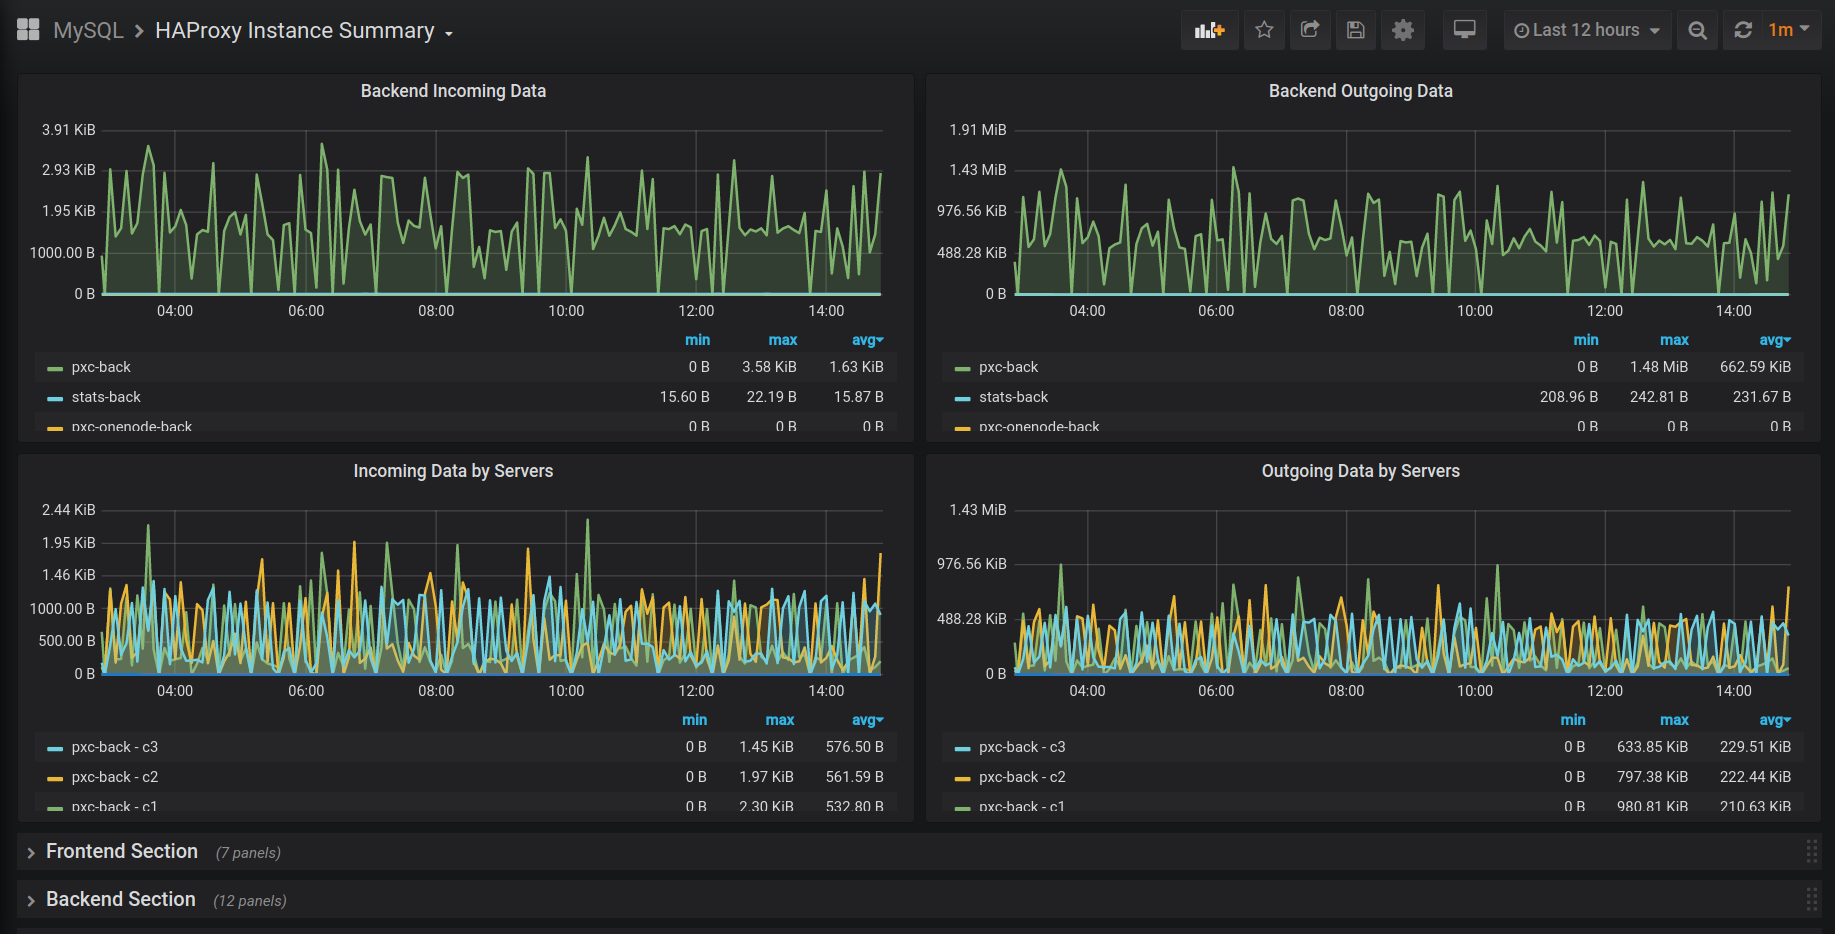
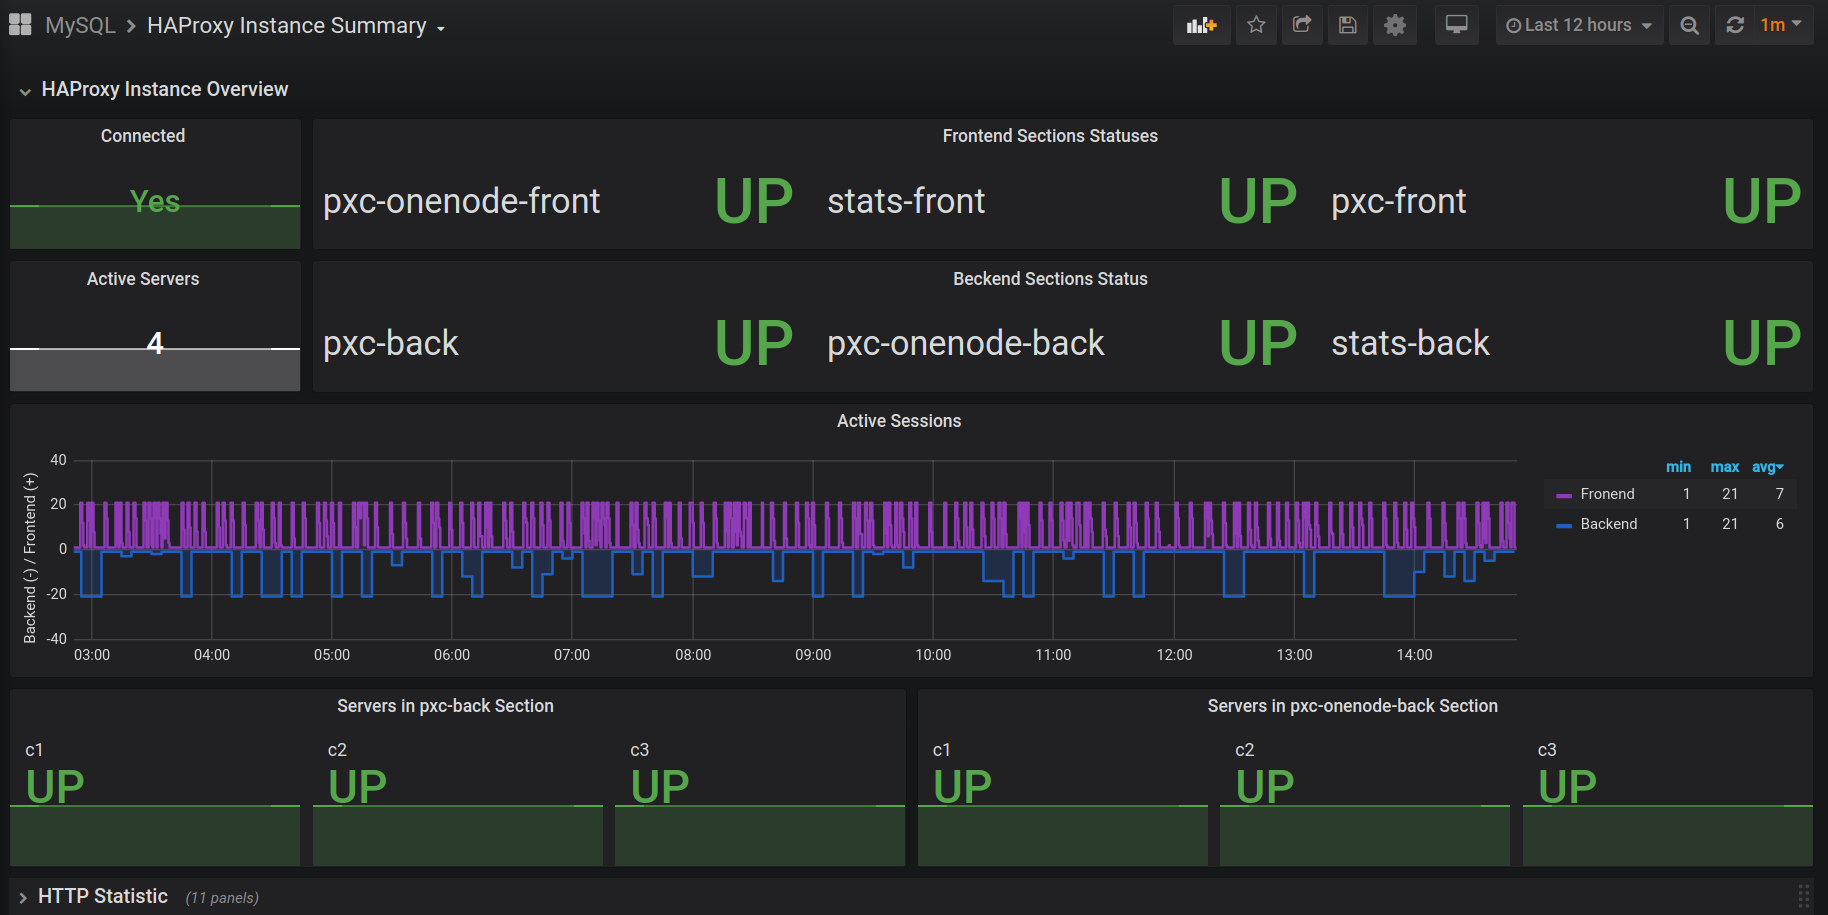
This dashboard displays the detailed HAProxy information of sections and backend servers. It's designed for PMM with the Prometheus haproxy exporter. The exporter can be added as an external exporter.
$ ./haproxy_exporter --haproxy.scrape-uri="http://pxcstats:secret@localhost/haproxy/stats?stats;csv"
$ pmm-admin add external --listen-port=9101 --service-name="haproxy1" --metrics-path=/metrics
Data source config
Collector type:
Collector plugins:
Collector config:
Revisions
Upload an updated version of an exported dashboard.json file from Grafana
| Revision | Description | Created | |
|---|---|---|---|
| Download |
HAProxy
Easily monitor HAProxy, a free, fast, and reliable reverse-proxy, with Grafana Cloud's out-of-the-box monitoring solution.
Learn more