Spring Boot Statistics(6756-tomcat)
Dashboard for Spring Boot2 Statistics(by micrometer-prometheus). forked from 6756. add job as variables. refer to: https://grafana.com/grafana/dashboards/6756 Team: http://www.xkw.com
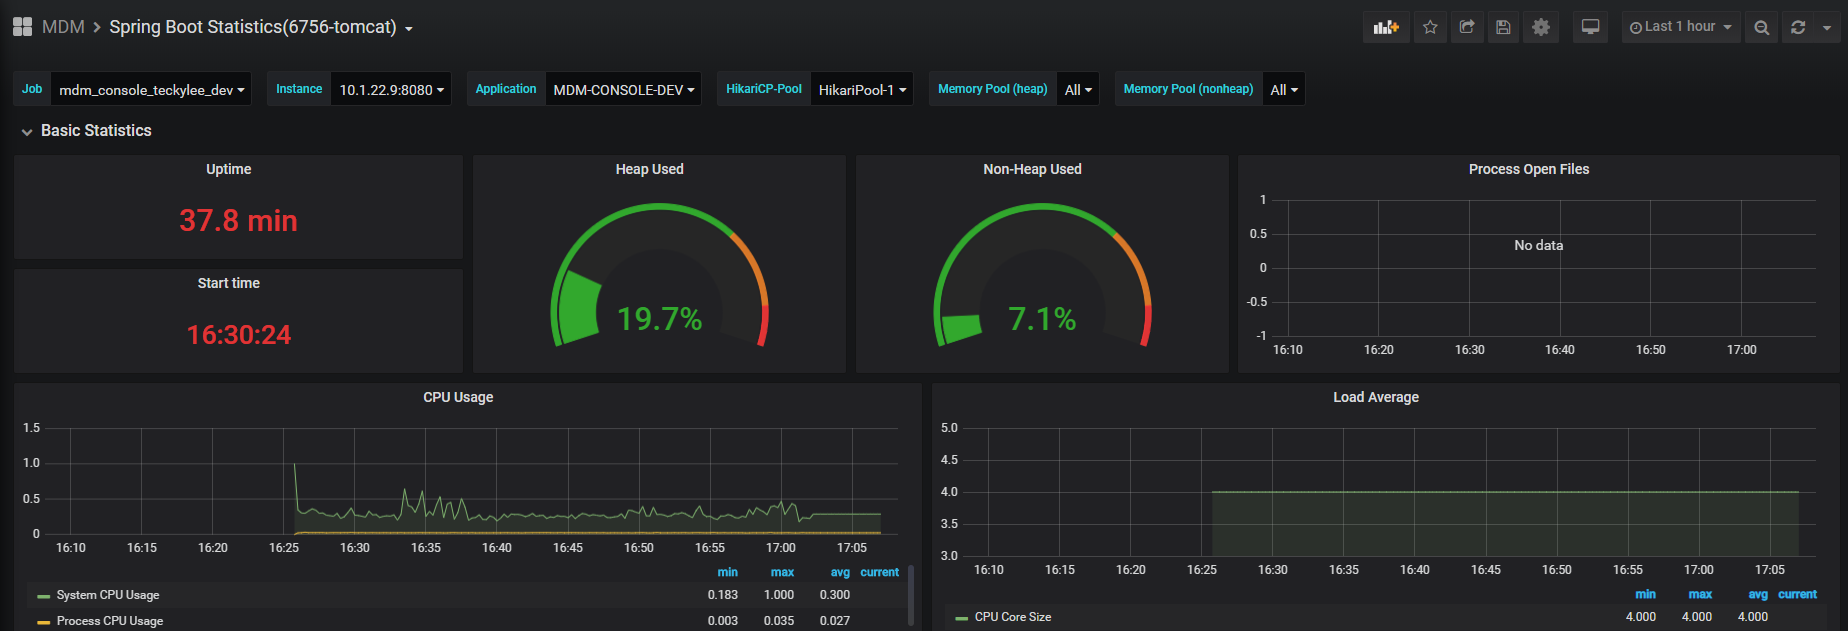
The Spring Boot Statistics(6756-tomcat) dashboard uses the prometheus data source to create a Grafana dashboard with the graph and singlestat panels.
Data source config
Collector type:
Collector plugins:
Collector config:
Revisions
Upload an updated version of an exported dashboard.json file from Grafana
| Revision | Description | Created | |
|---|---|---|---|
| Download |
Spring Boot
Easily monitor Spring Boot with Grafana Cloud's out-of-the-box monitoring solution.
Learn more