Zabbix-Docker
Docker dashboard ready for works with Zabbix Agent version 2
Features
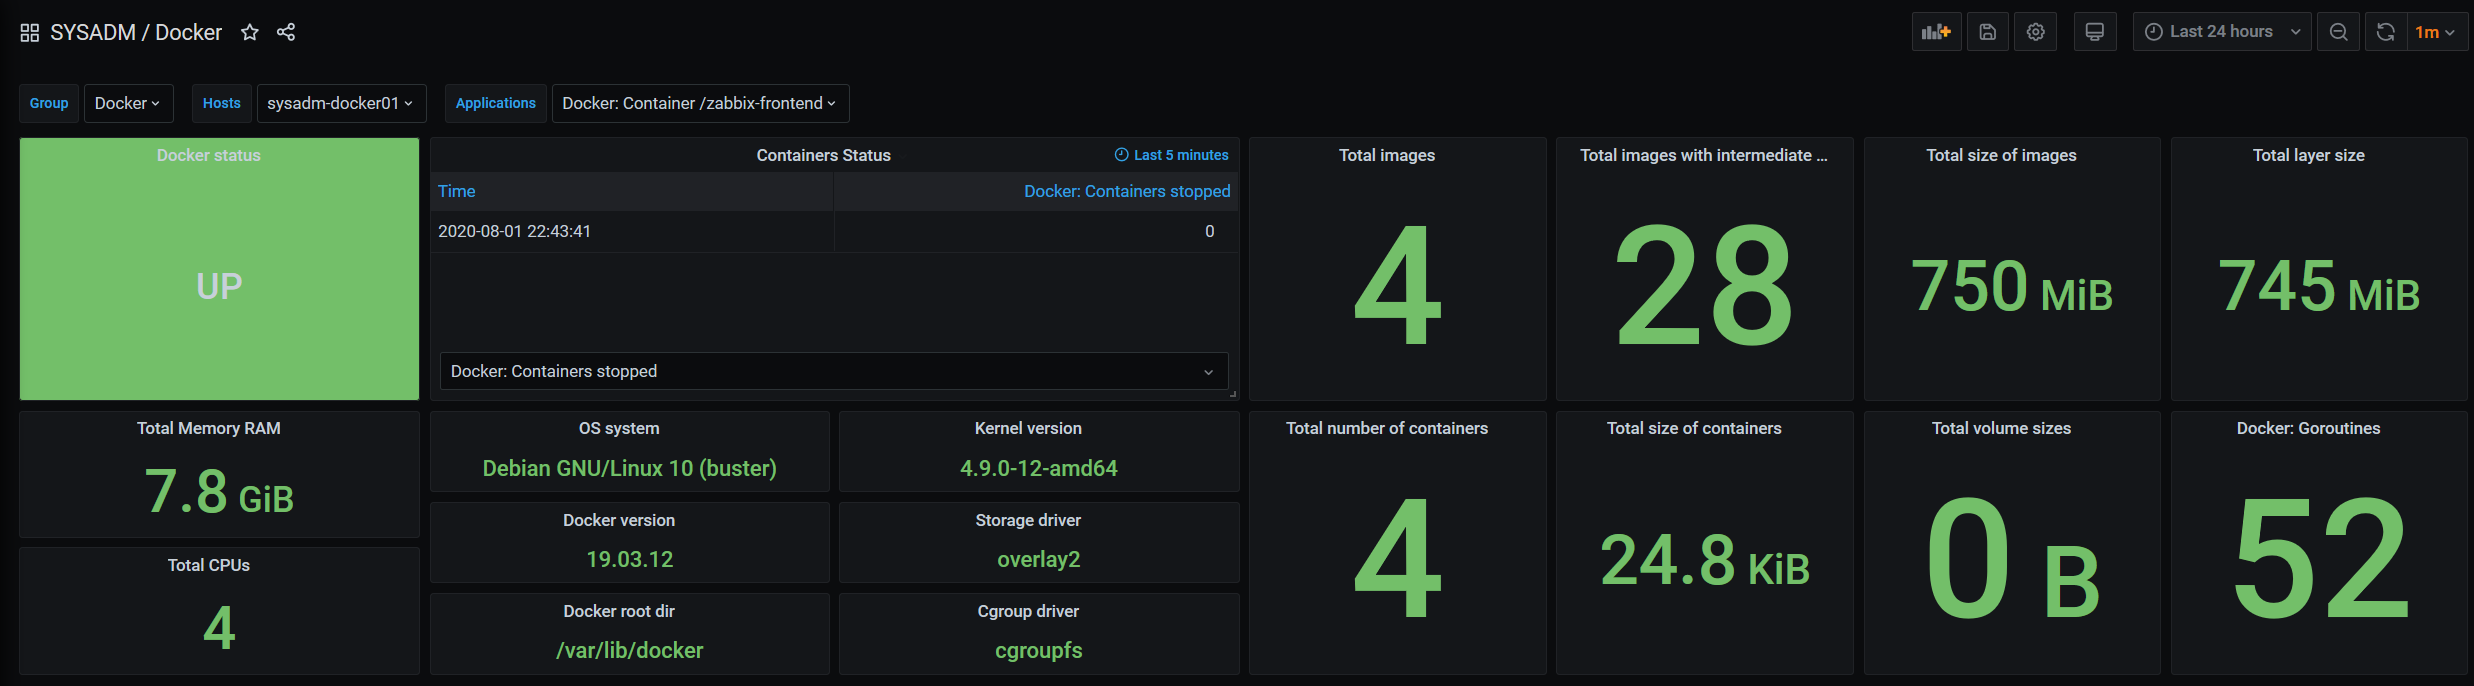
- Status of the docker service with color alert.
- Containers running/paused/stopped.
- Total containers/images by size.
- Stats availables from the machine like OS version, kernel, drivers, CPU, RAM availables.
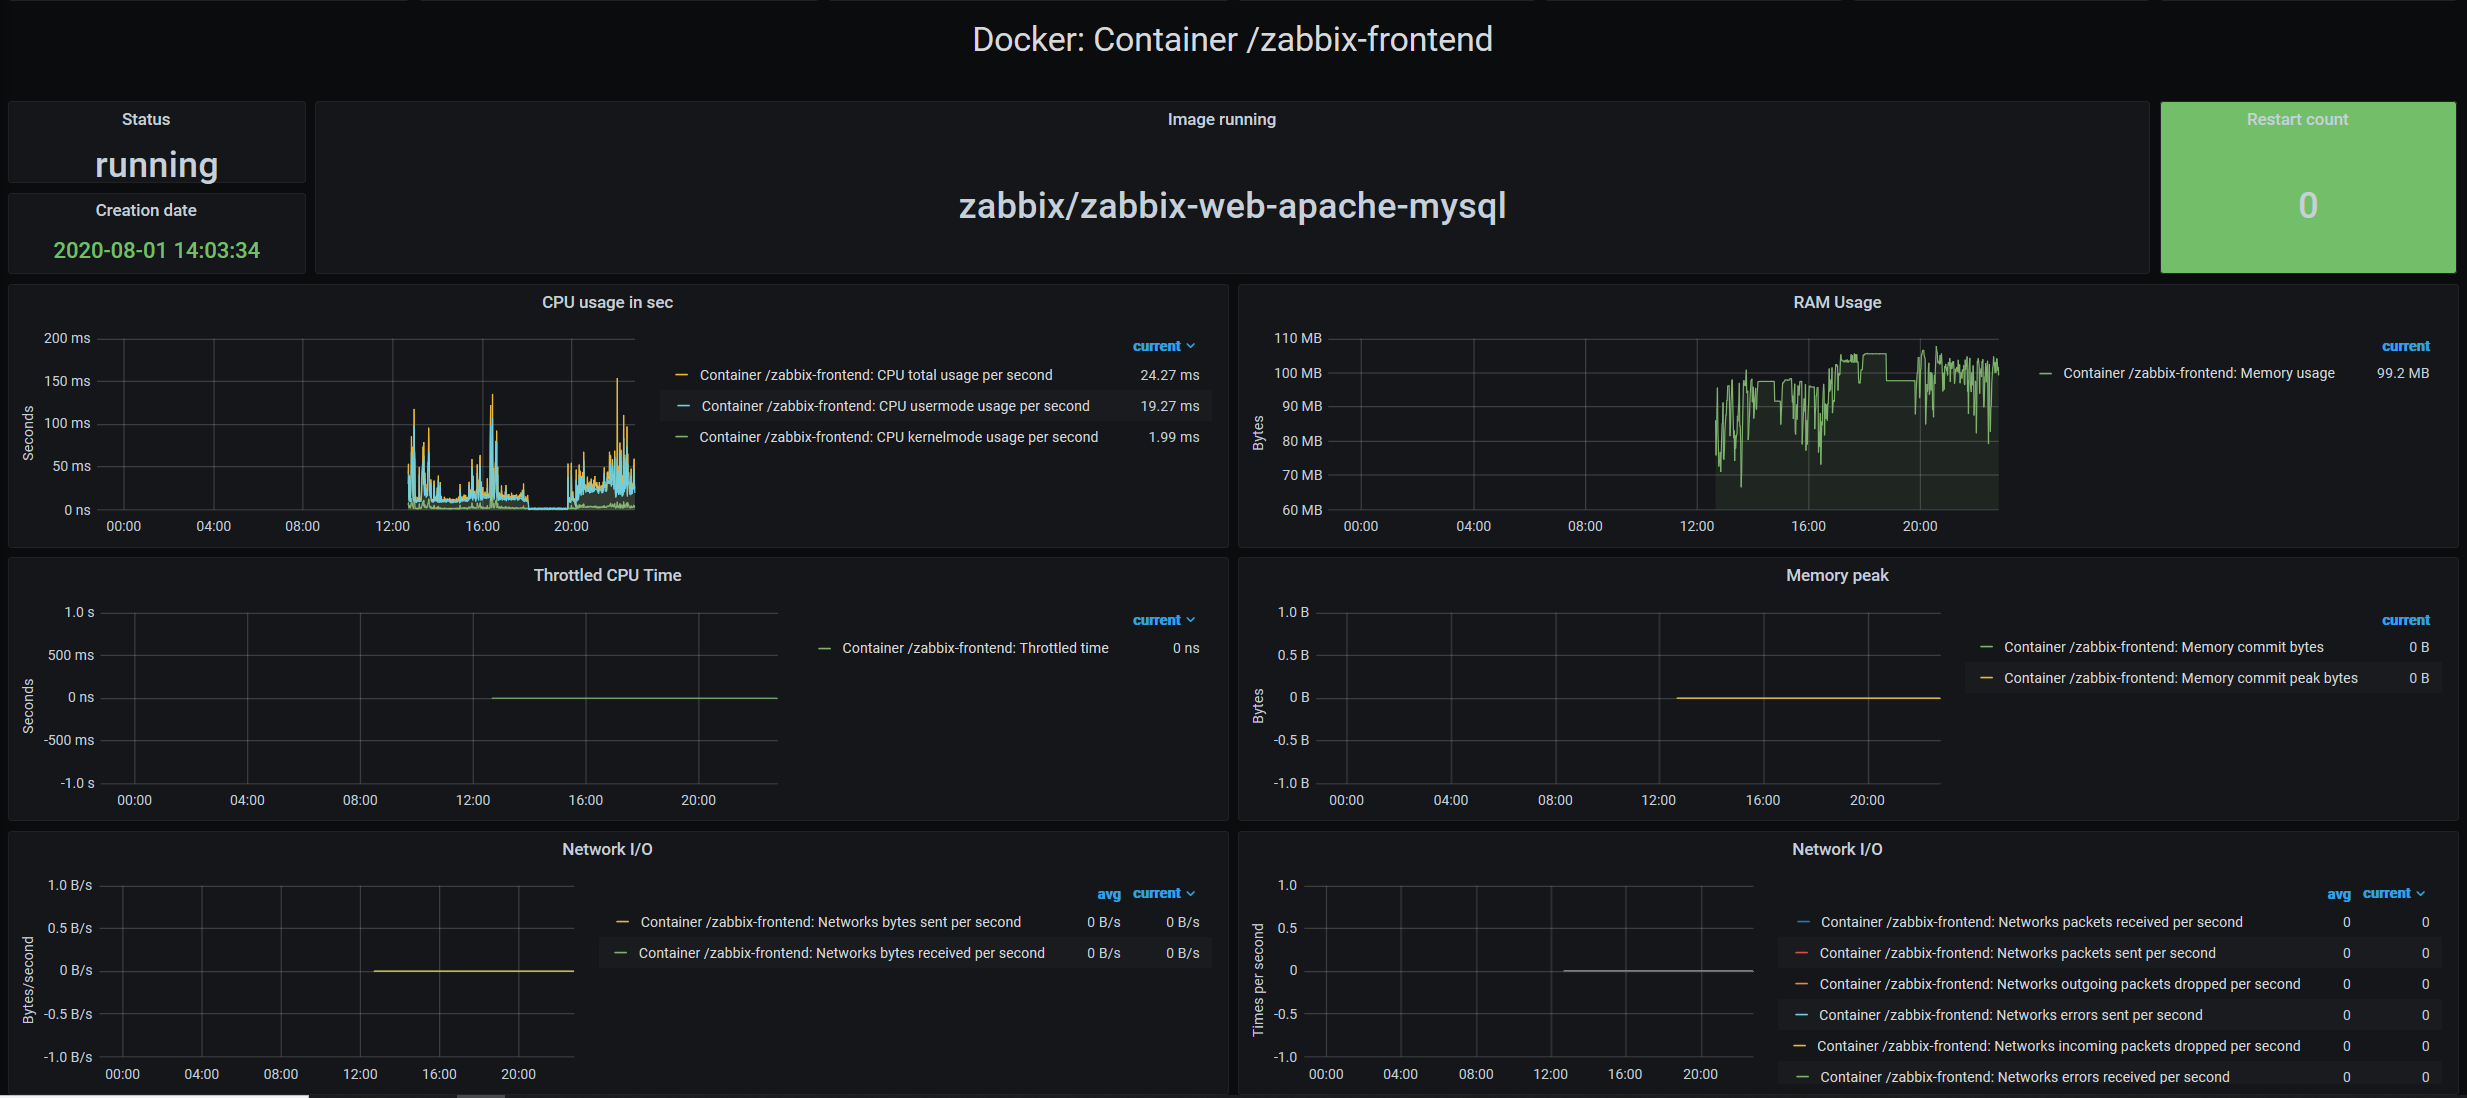
- Auto Discovery for containers with creation date, image used, Restart count with alert color.
- CPU Usage time and Throottled time.
- RAM Usage and peak usage.
- Network I/O metrics.
Requeriments
- Zabbix Agent V2
- Datasource: Zabbix
- Your host must have a host group with the regex name Docker
- Zabbix Template: https://www.zabbix.com/integrations/docker#tab:official1
Support

Data source config
Collector type:
Collector plugins:
Collector config:
Revisions
Upload an updated version of an exported dashboard.json file from Grafana
| Revision | Description | Created | |
|---|---|---|---|
| Download |
Docker
Easily monitor Docker with Grafana Cloud's out-of-the-box monitoring solution.
Learn more