CPU与MEM资源总体使用情况及Limit总体情况
集群CPU与MEM的资源总和、使用情况、设置的Limit数值。
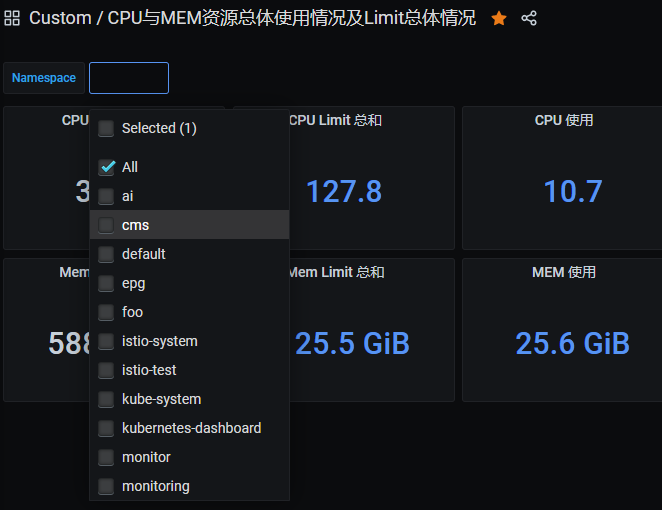
The CPU与MEM资源总体使用情况及Limit总体情况 dashboard uses the prometheus data source to create a Grafana dashboard with the singlestat panel.
Data source config
Collector type:
Collector plugins:
Collector config:
Revisions
Upload an updated version of an exported dashboard.json file from Grafana
| Revision | Description | Created | |
|---|---|---|---|
| Download |