Kancy Spring Boot 2.1 Statistics
Dashboard for Spring Boot2.1 Statistics(based on Spring Boot2 Statistic by micrometer-prometheus).
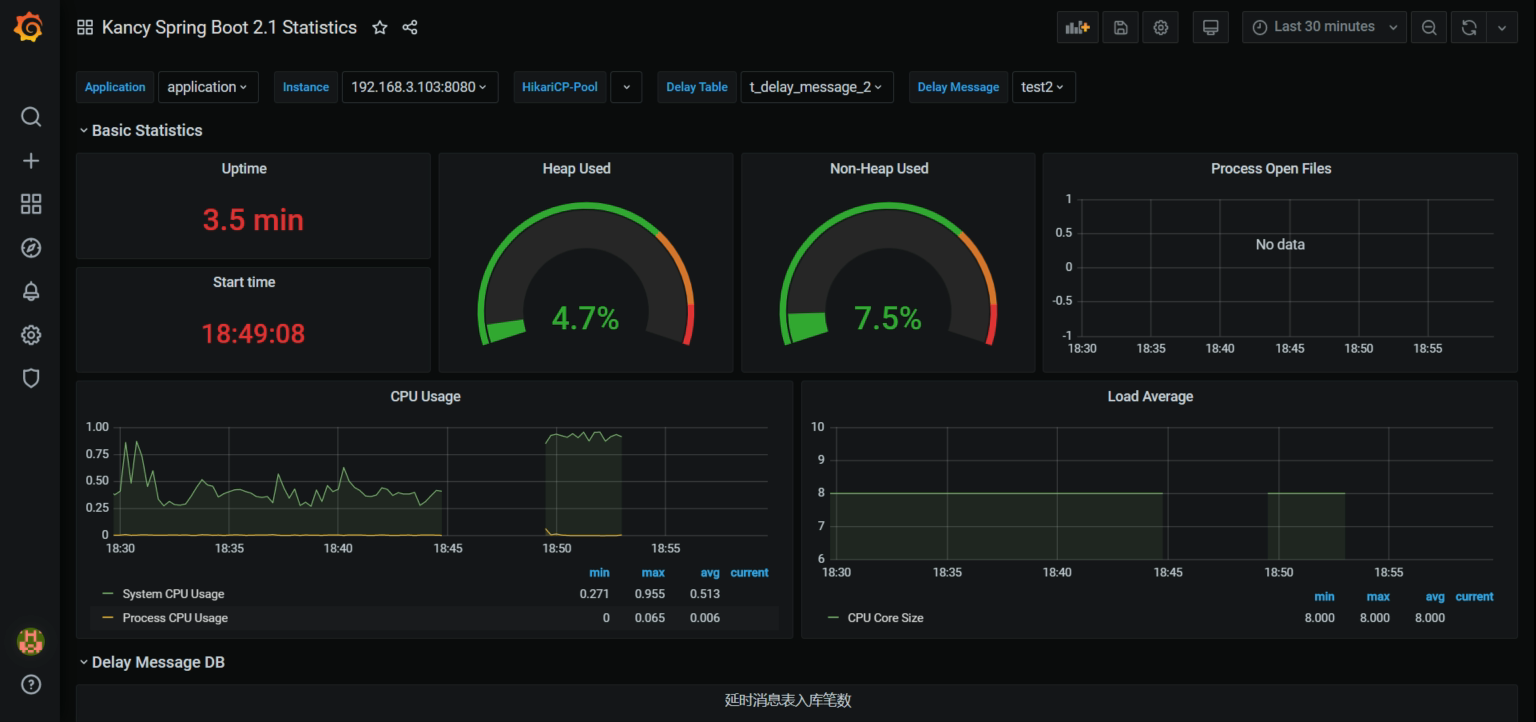
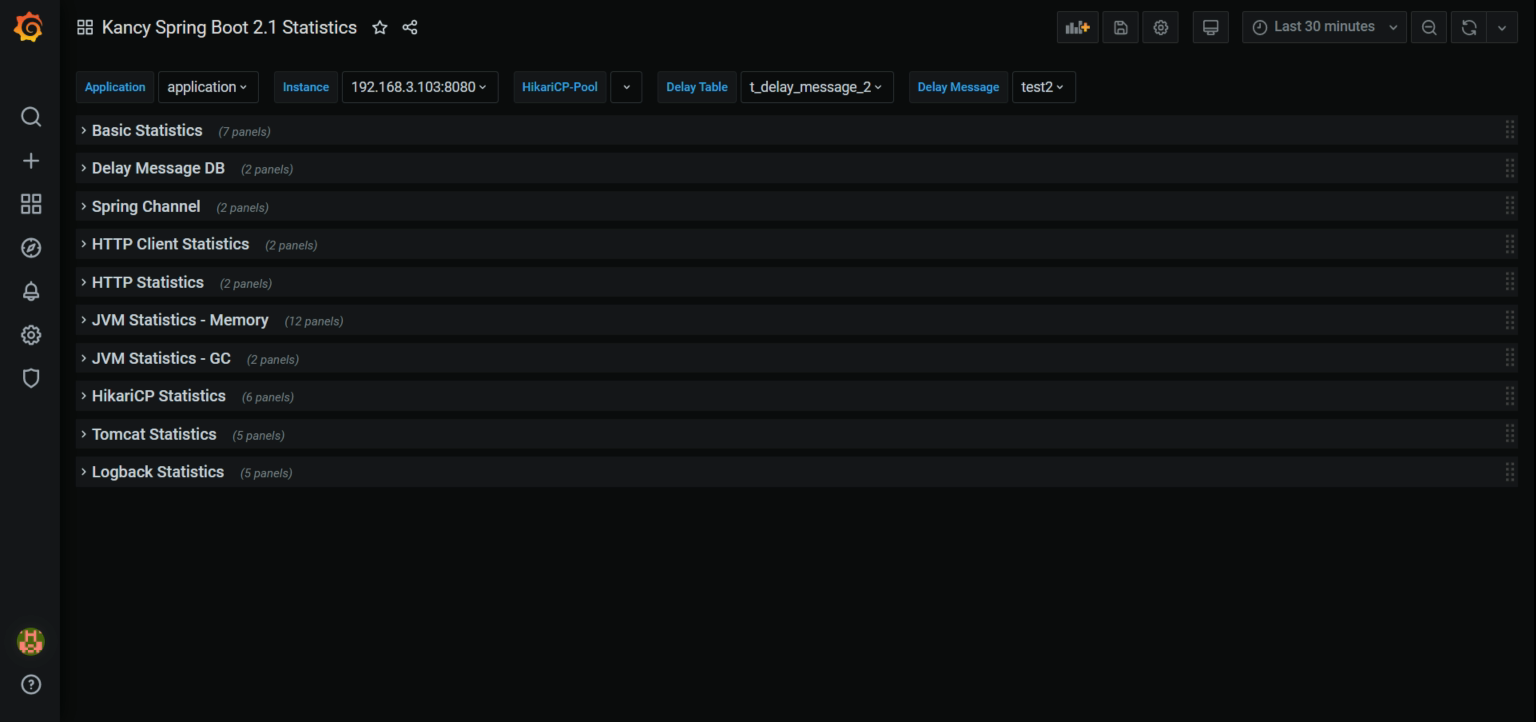
The Kancy Spring Boot 2.1 Statistics dashboard uses the prometheus data source to create a Grafana dashboard with the graph and singlestat panels.
Data source config
Collector type:
Collector plugins:
Collector config:
Revisions
Upload an updated version of an exported dashboard.json file from Grafana
| Revision | Description | Created | |
|---|---|---|---|
| Download |
Spring Boot
Easily monitor Spring Boot with Grafana Cloud's out-of-the-box monitoring solution.
Learn more