Atassian Bamboo
Atlassian Bamboo Grafana Dasboard With Best Possible Query to Use for Daily Usage
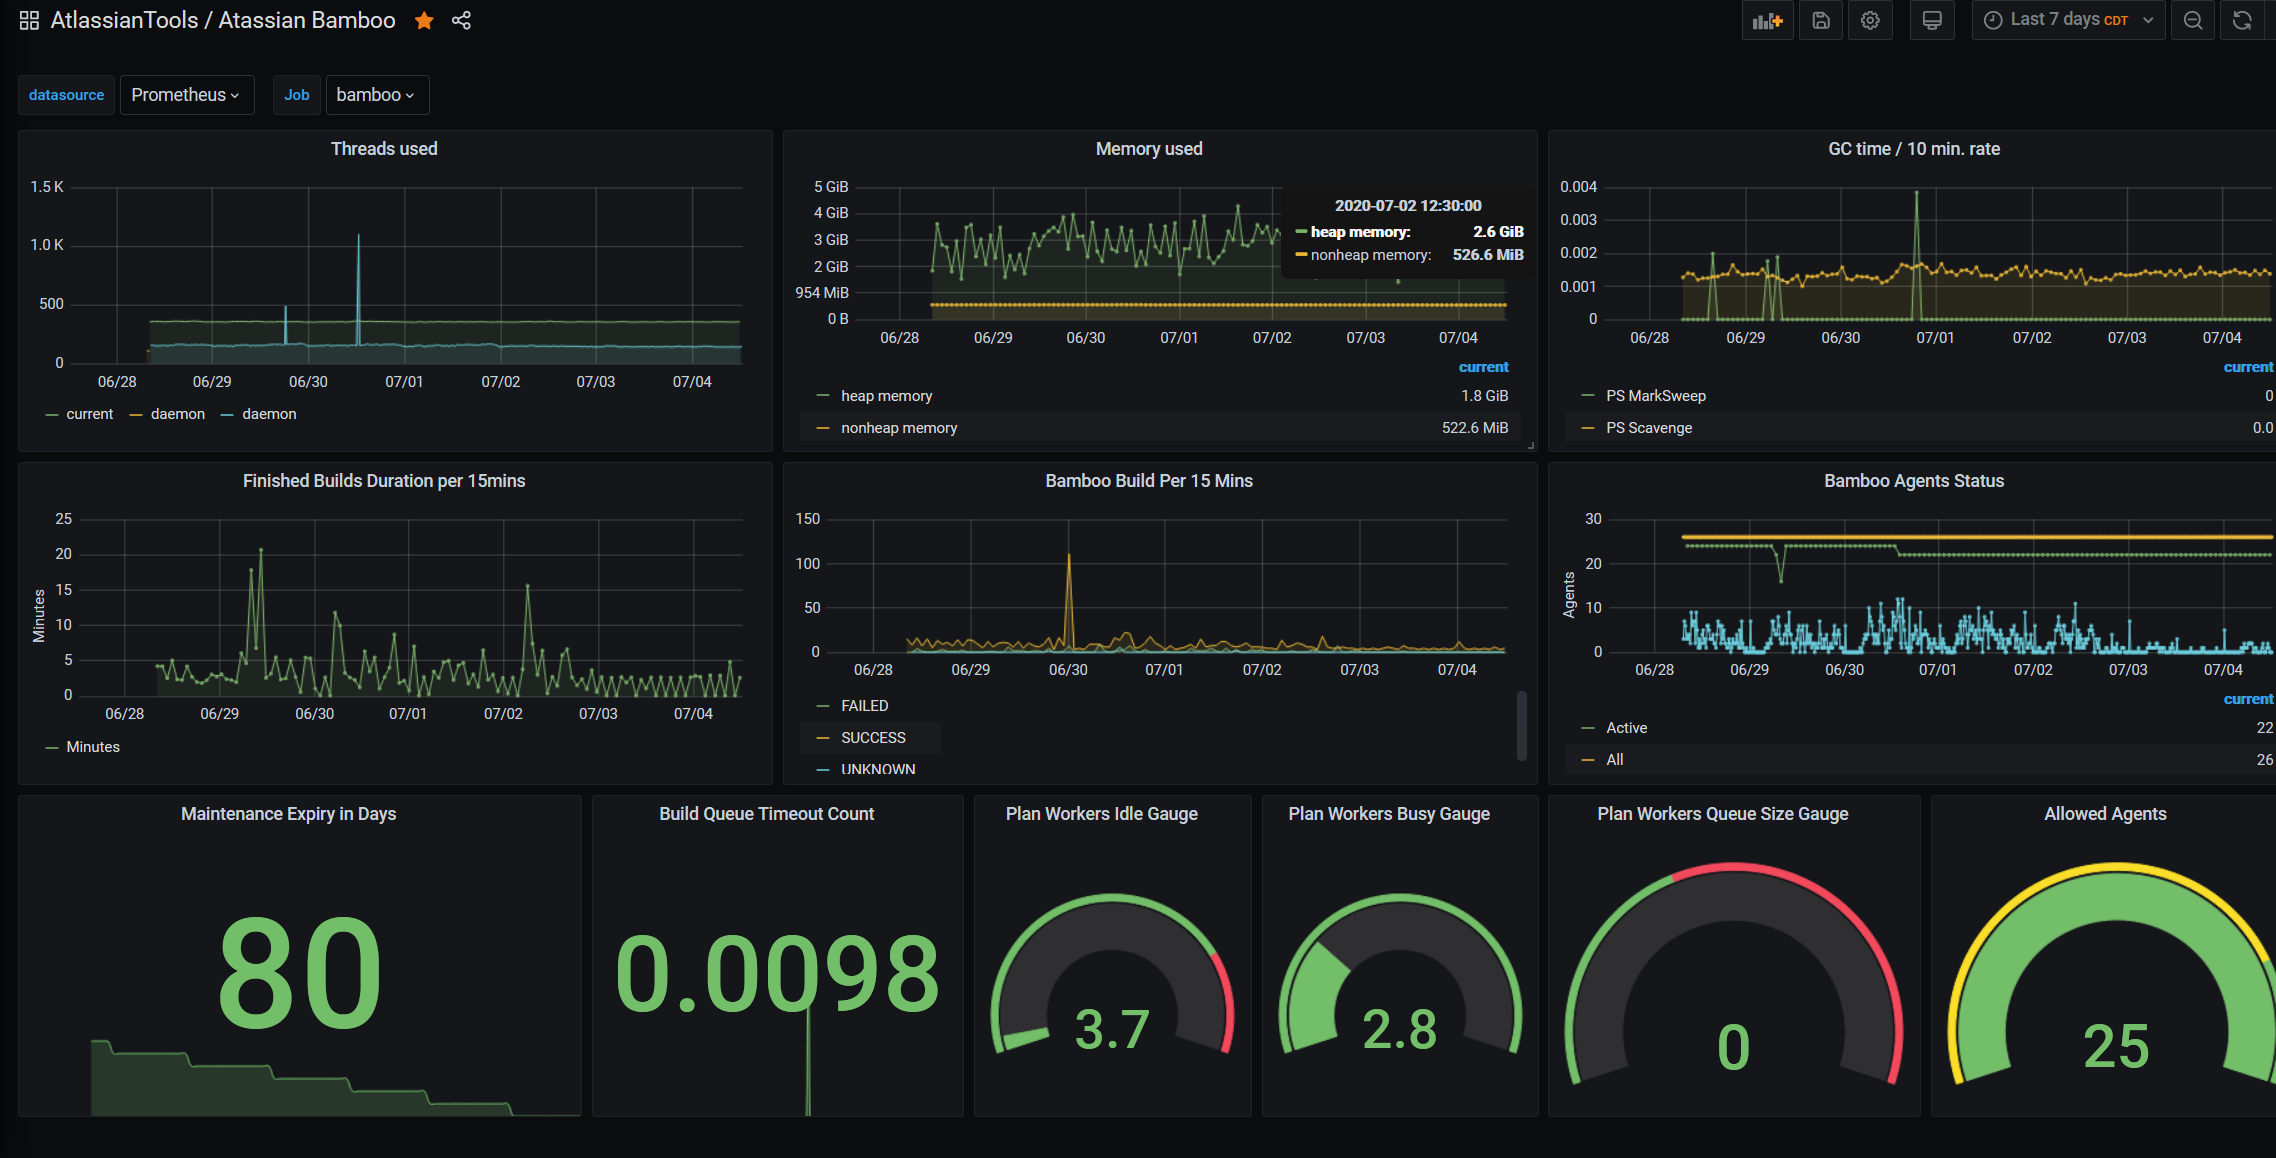
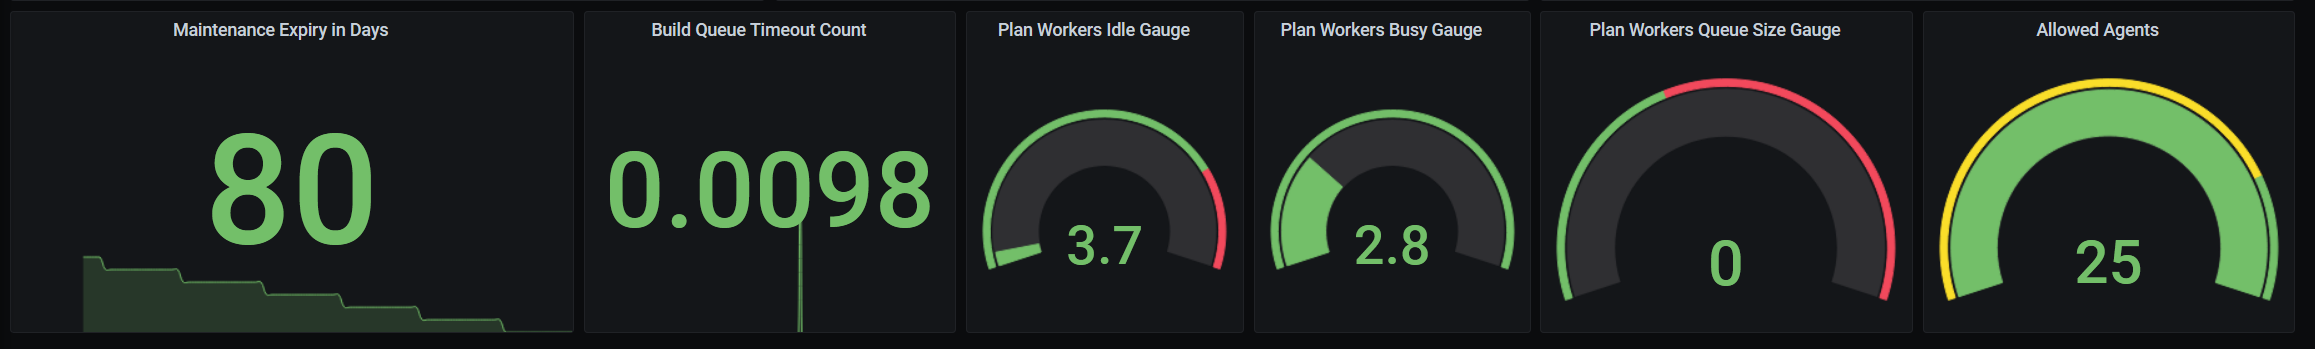
This dashboard is for reading Atlassian Bamboo metrics in the easiest way. It has Below three stats that are very relative for our daily bamboo metrics monitoring.
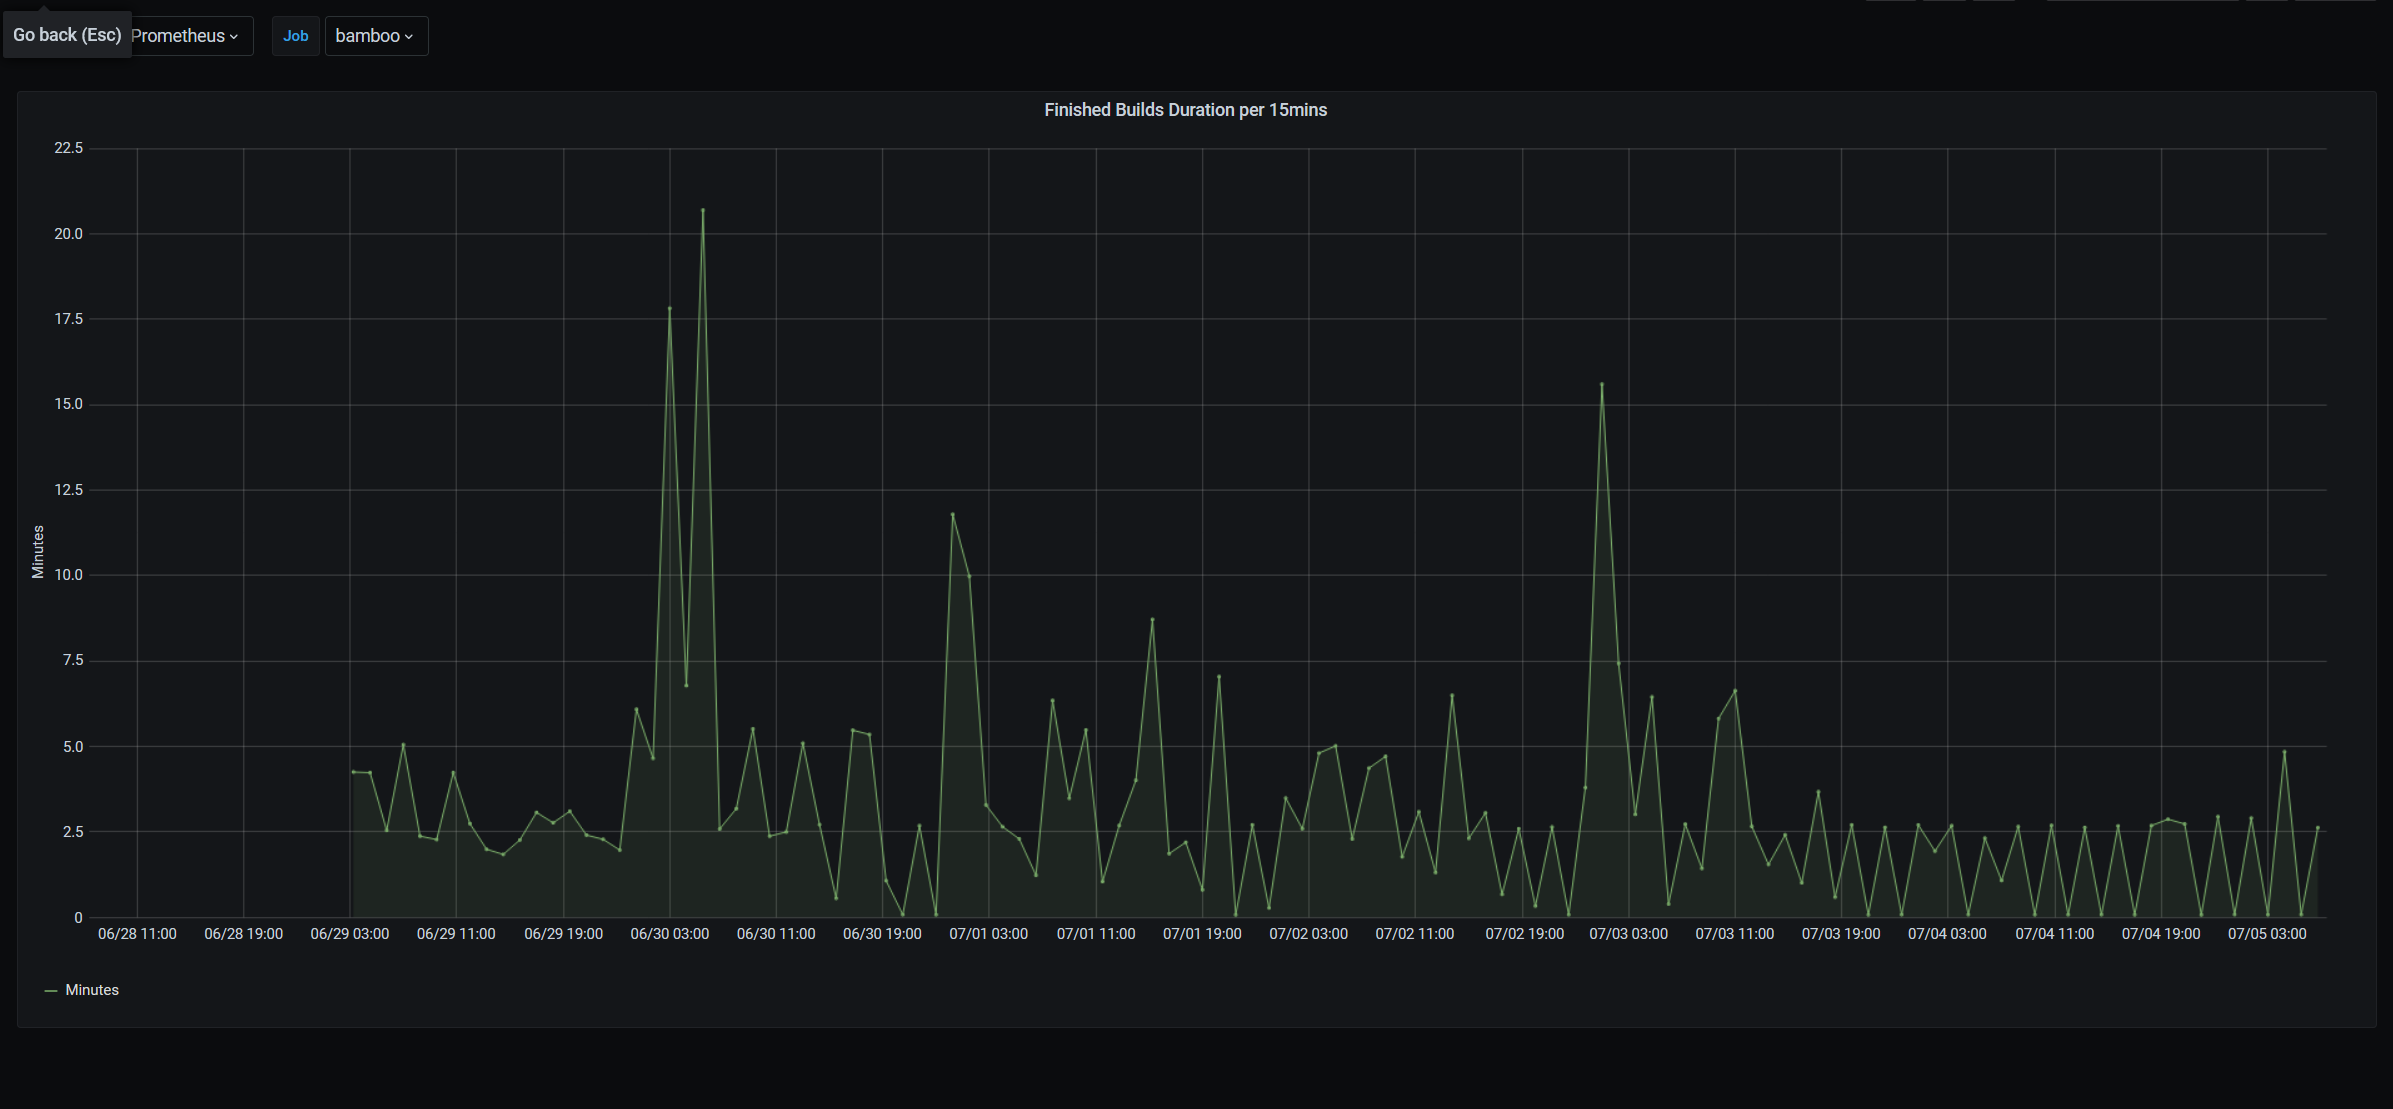
- Finished Build Duration per 15 Mins. (Execution Time)
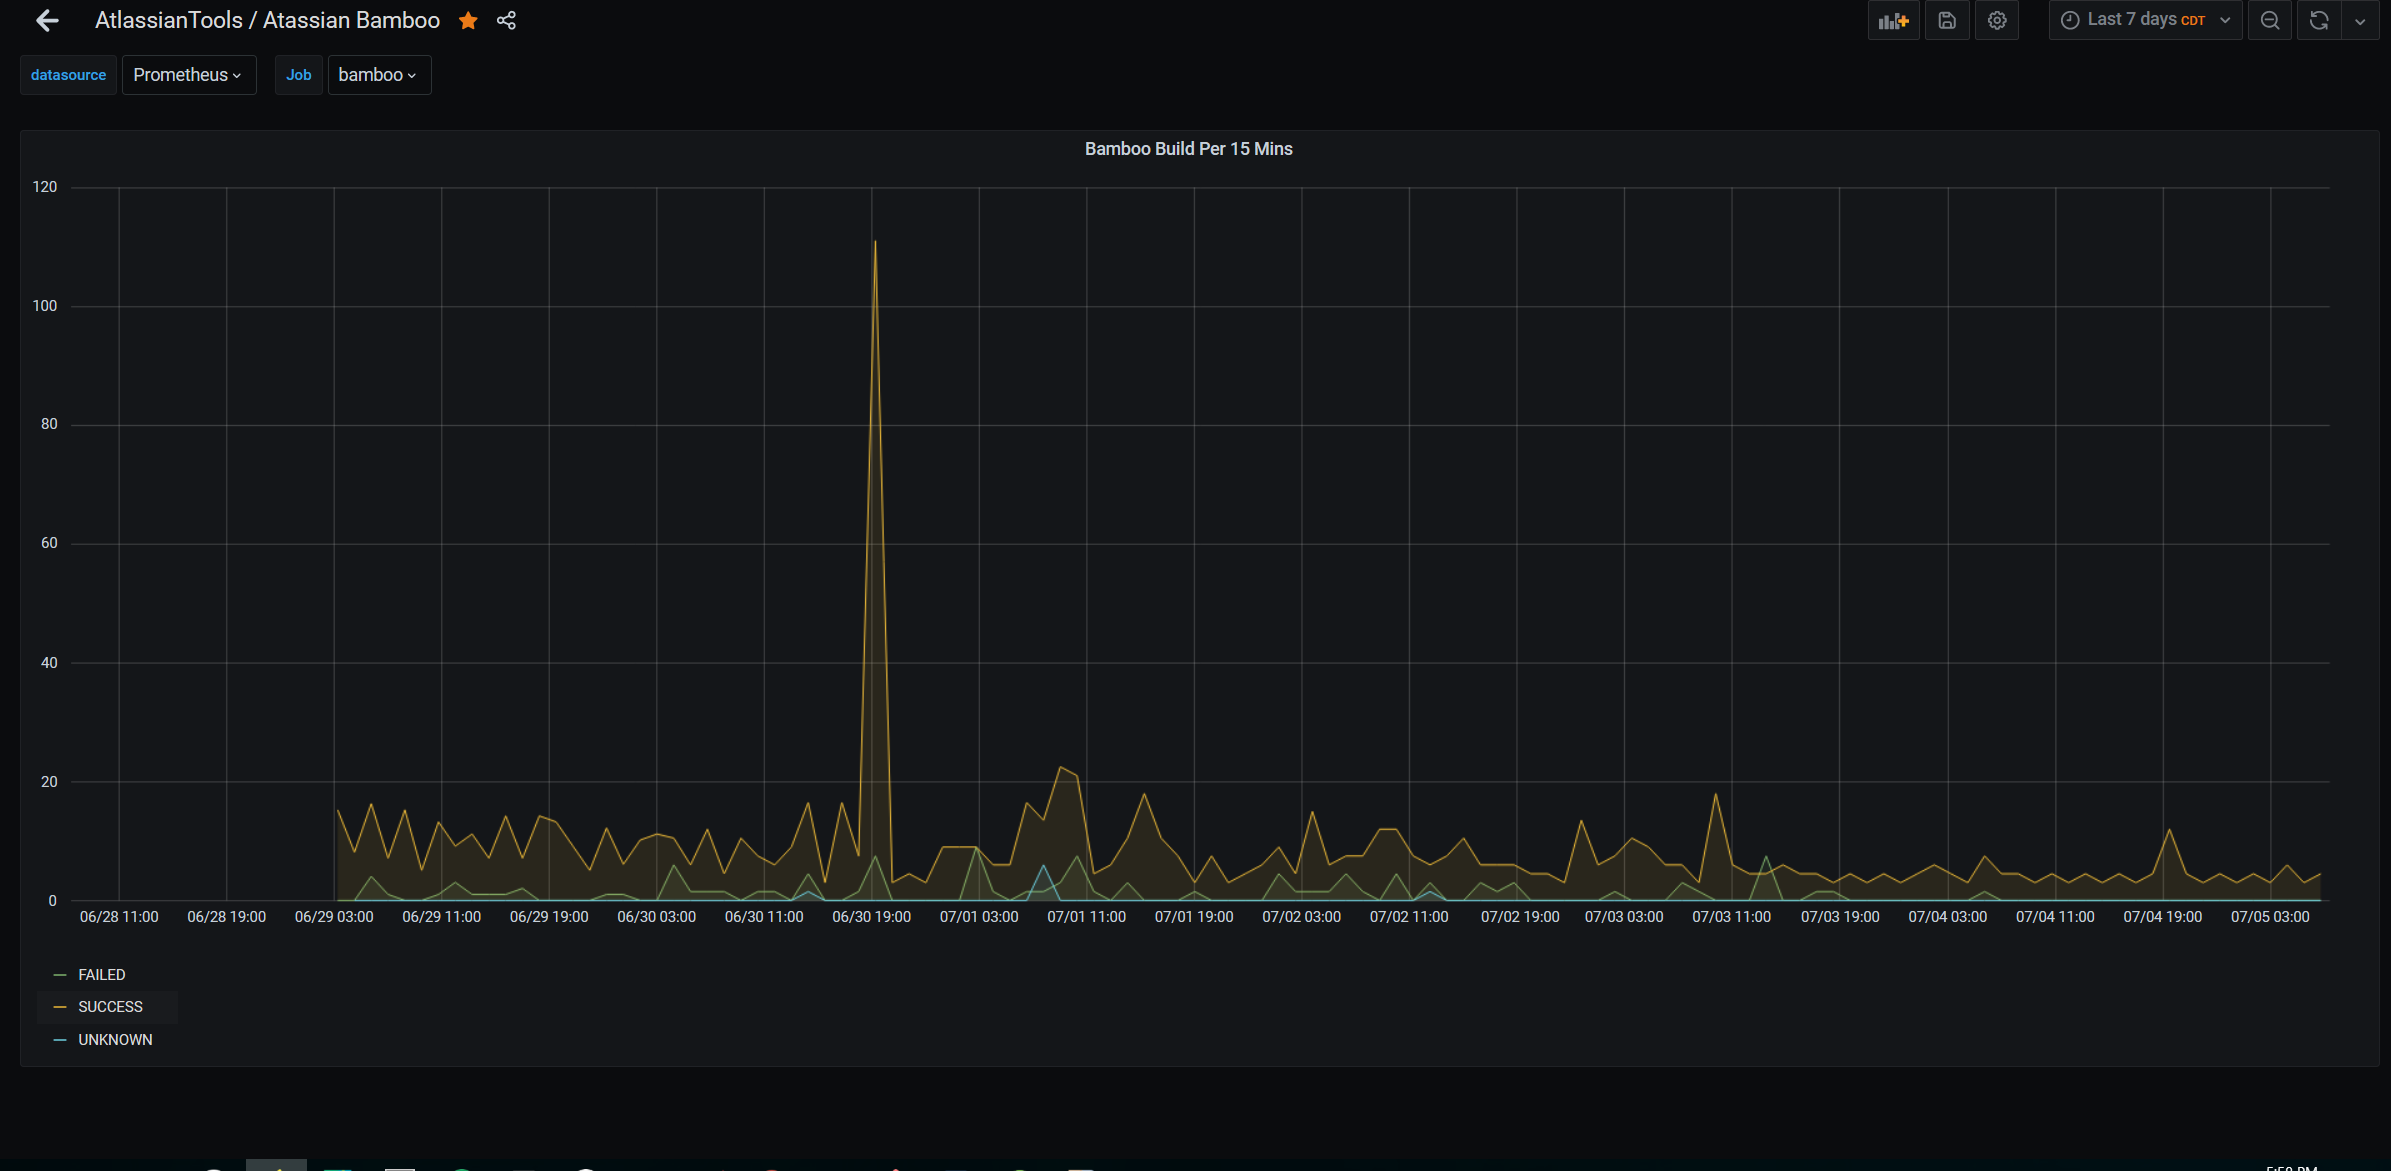
- Bamboo Build Status per 15 Mins. (Status)
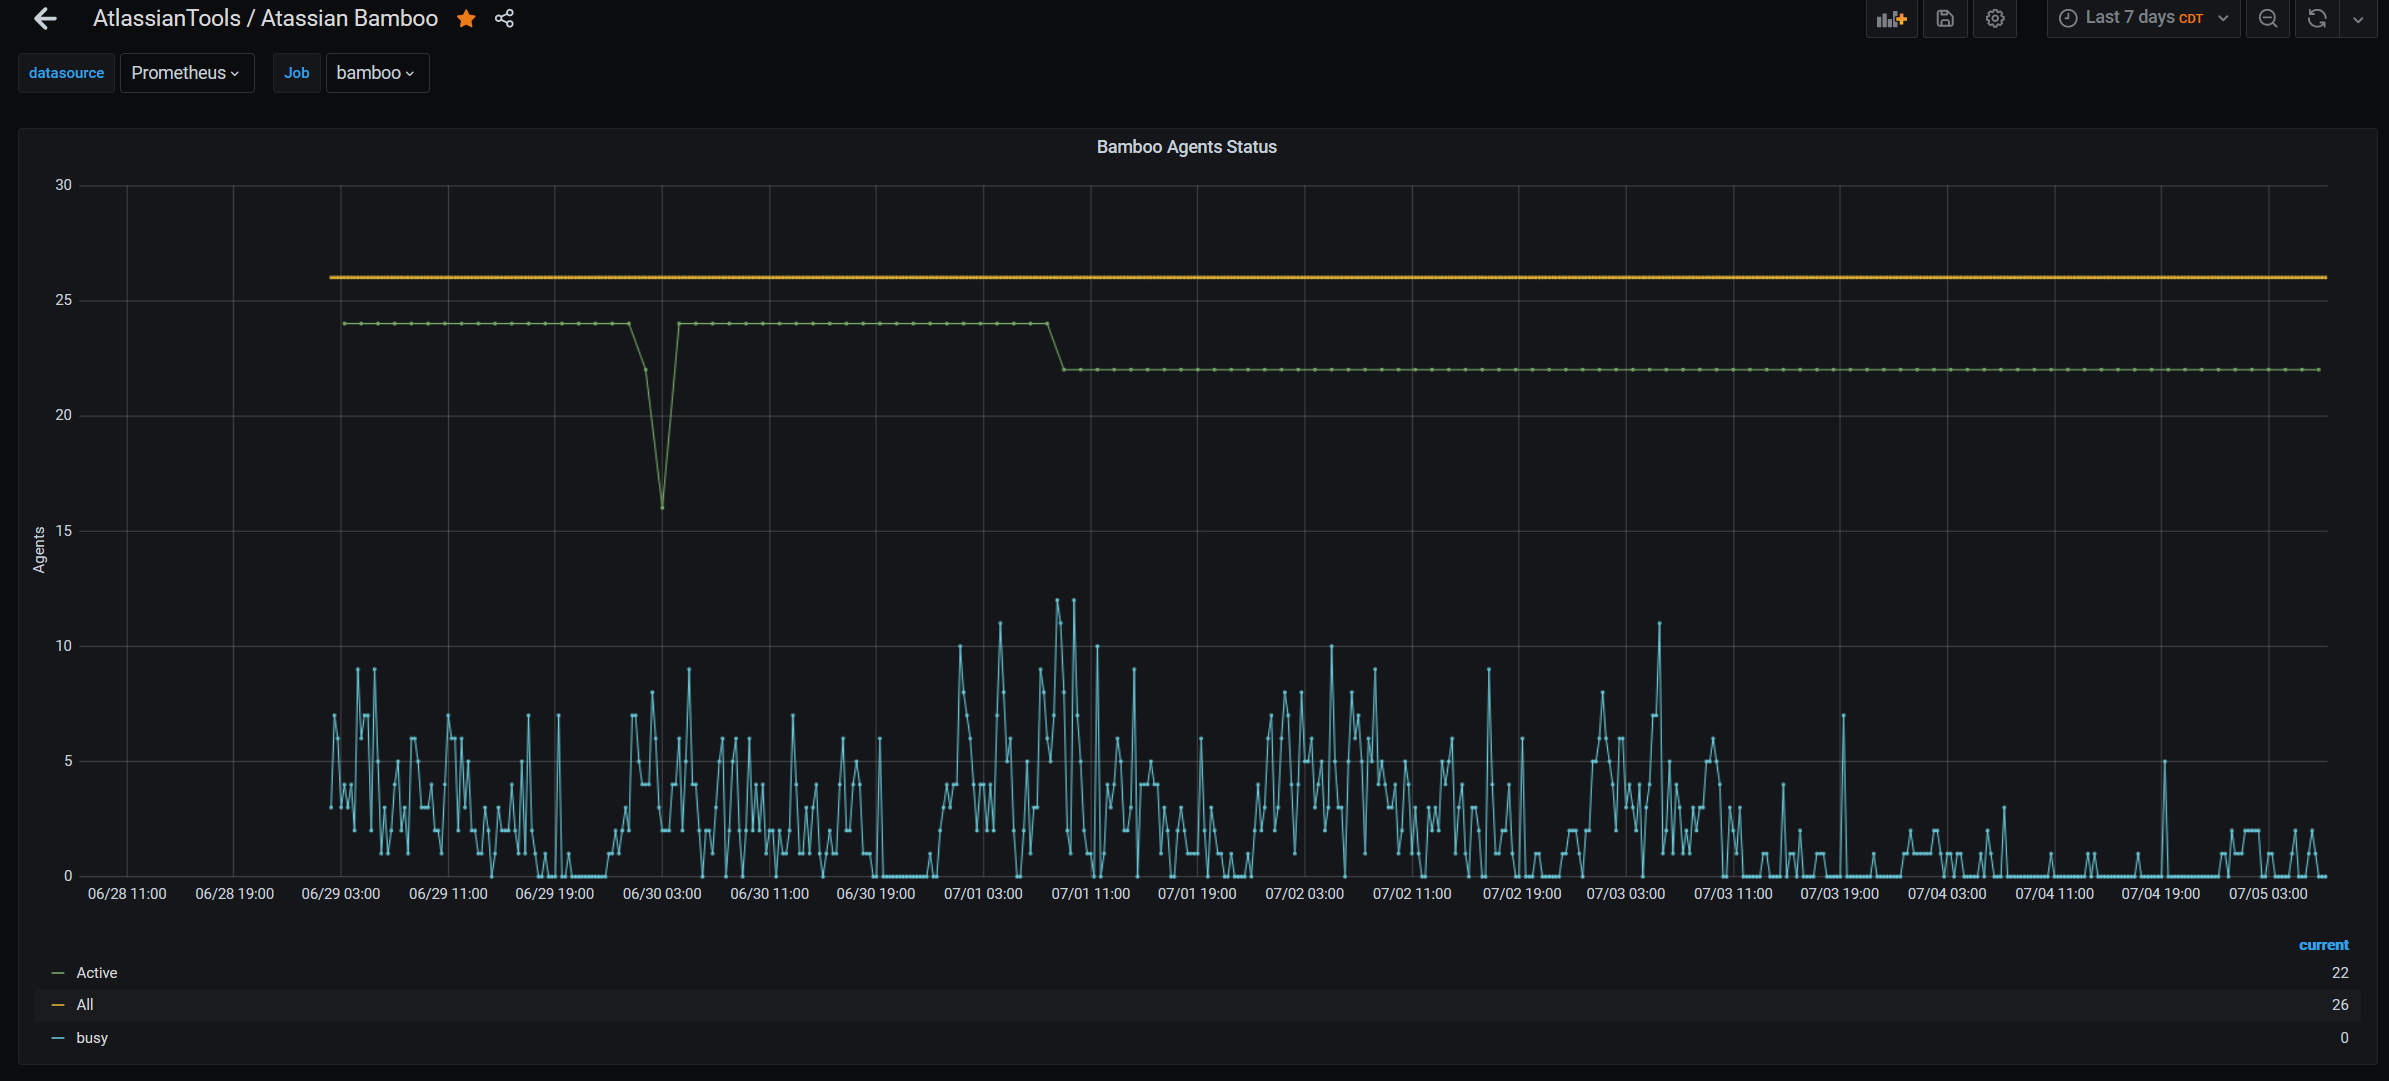
- Agents Status (All, Active, Busy)
This will only work if you have added the below plugin to your bamboo server and exposed the metrics.
Data source config
Collector type:
Collector plugins:
Collector config:
Revisions
Upload an updated version of an exported dashboard.json file from Grafana
| Revision | Description | Created | |
|---|---|---|---|
| Download |