FRITZ!Box Status
Monitor FRITZ!Box routers using prometheus and fritzbox_exporter
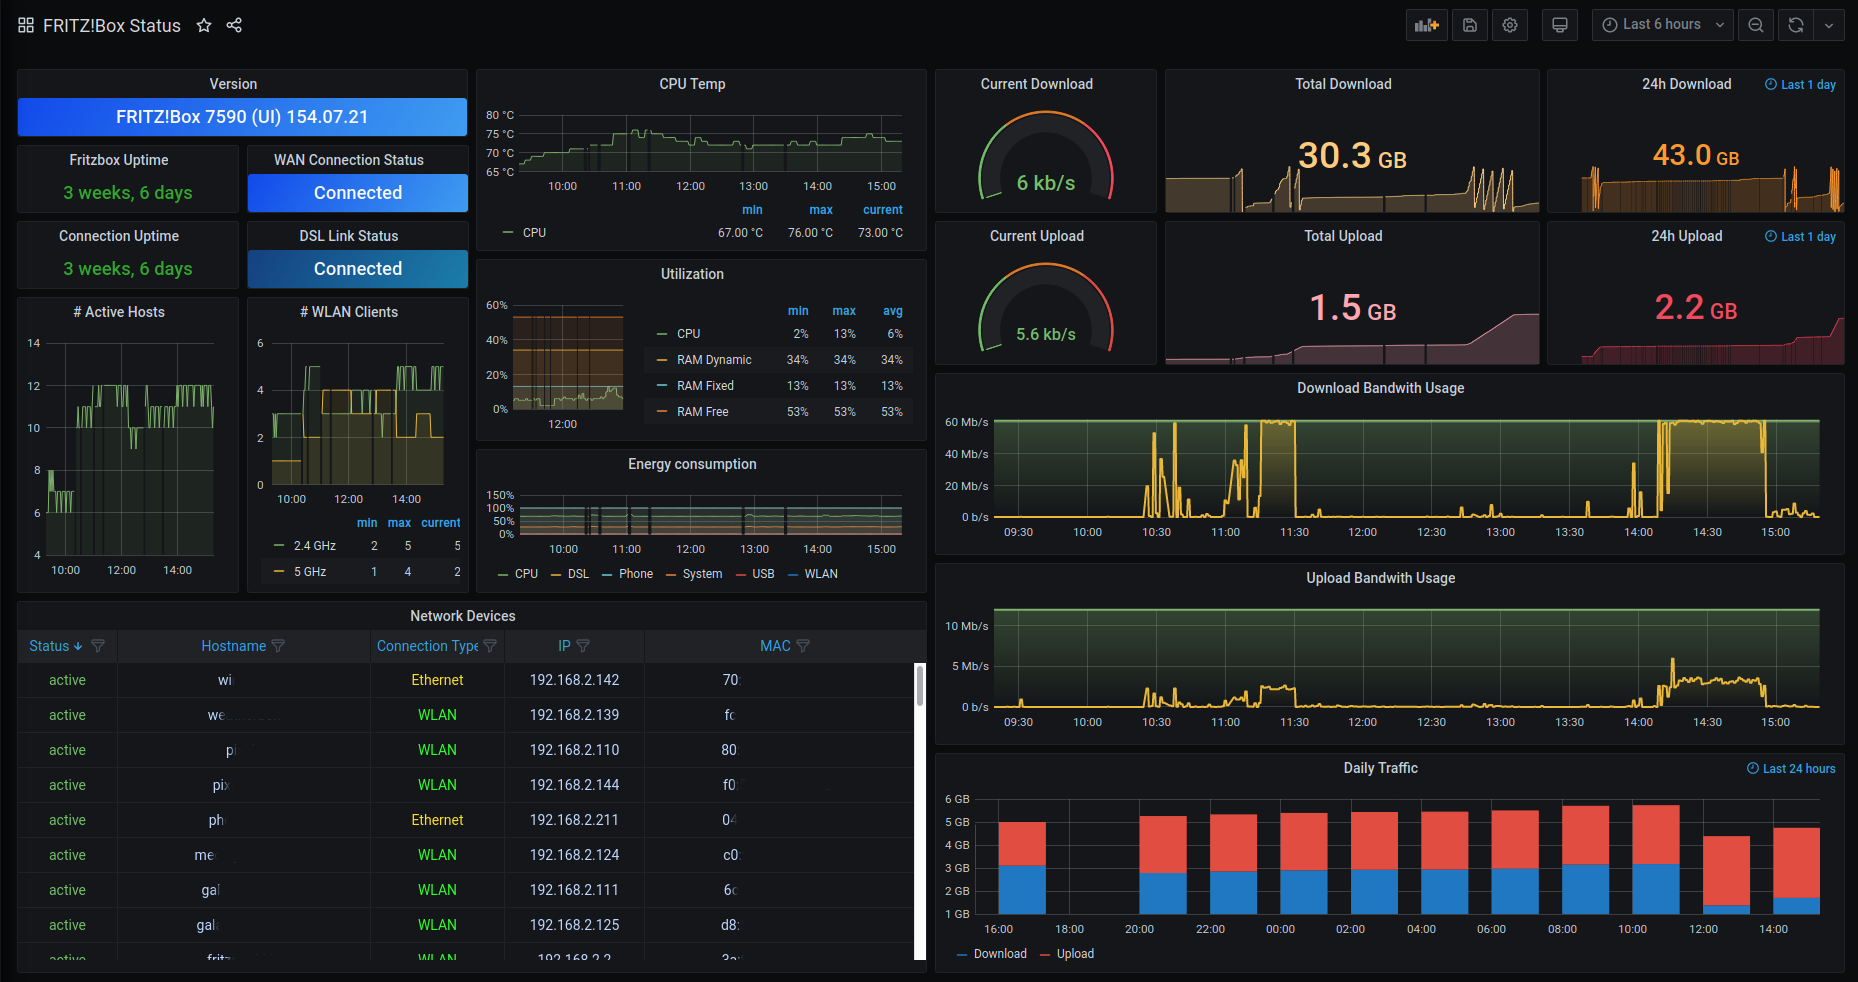
Dashboard working with this fritzbox prometheus exporter: https://github.com/sberk42/fritzbox_exporter
Adjusted to also work properly with grafana 7 (for grafana 6 use revision 1).
The dashboard was based on this influx based fritzbox dashboard: https://grafana.com/grafana/dashboards/713
It has been ported to using prometheus as datasource and enhanced.
Data source config
Collector type:
Collector plugins:
Collector config:
Revisions
Upload an updated version of an exported dashboard.json file from Grafana
| Revision | Description | Created | |
|---|---|---|---|
| Download |