Cloudbees CI Dashboard
Shows basic metrics for a Cloudbees CI deployment on Kubernetes using Prometheus
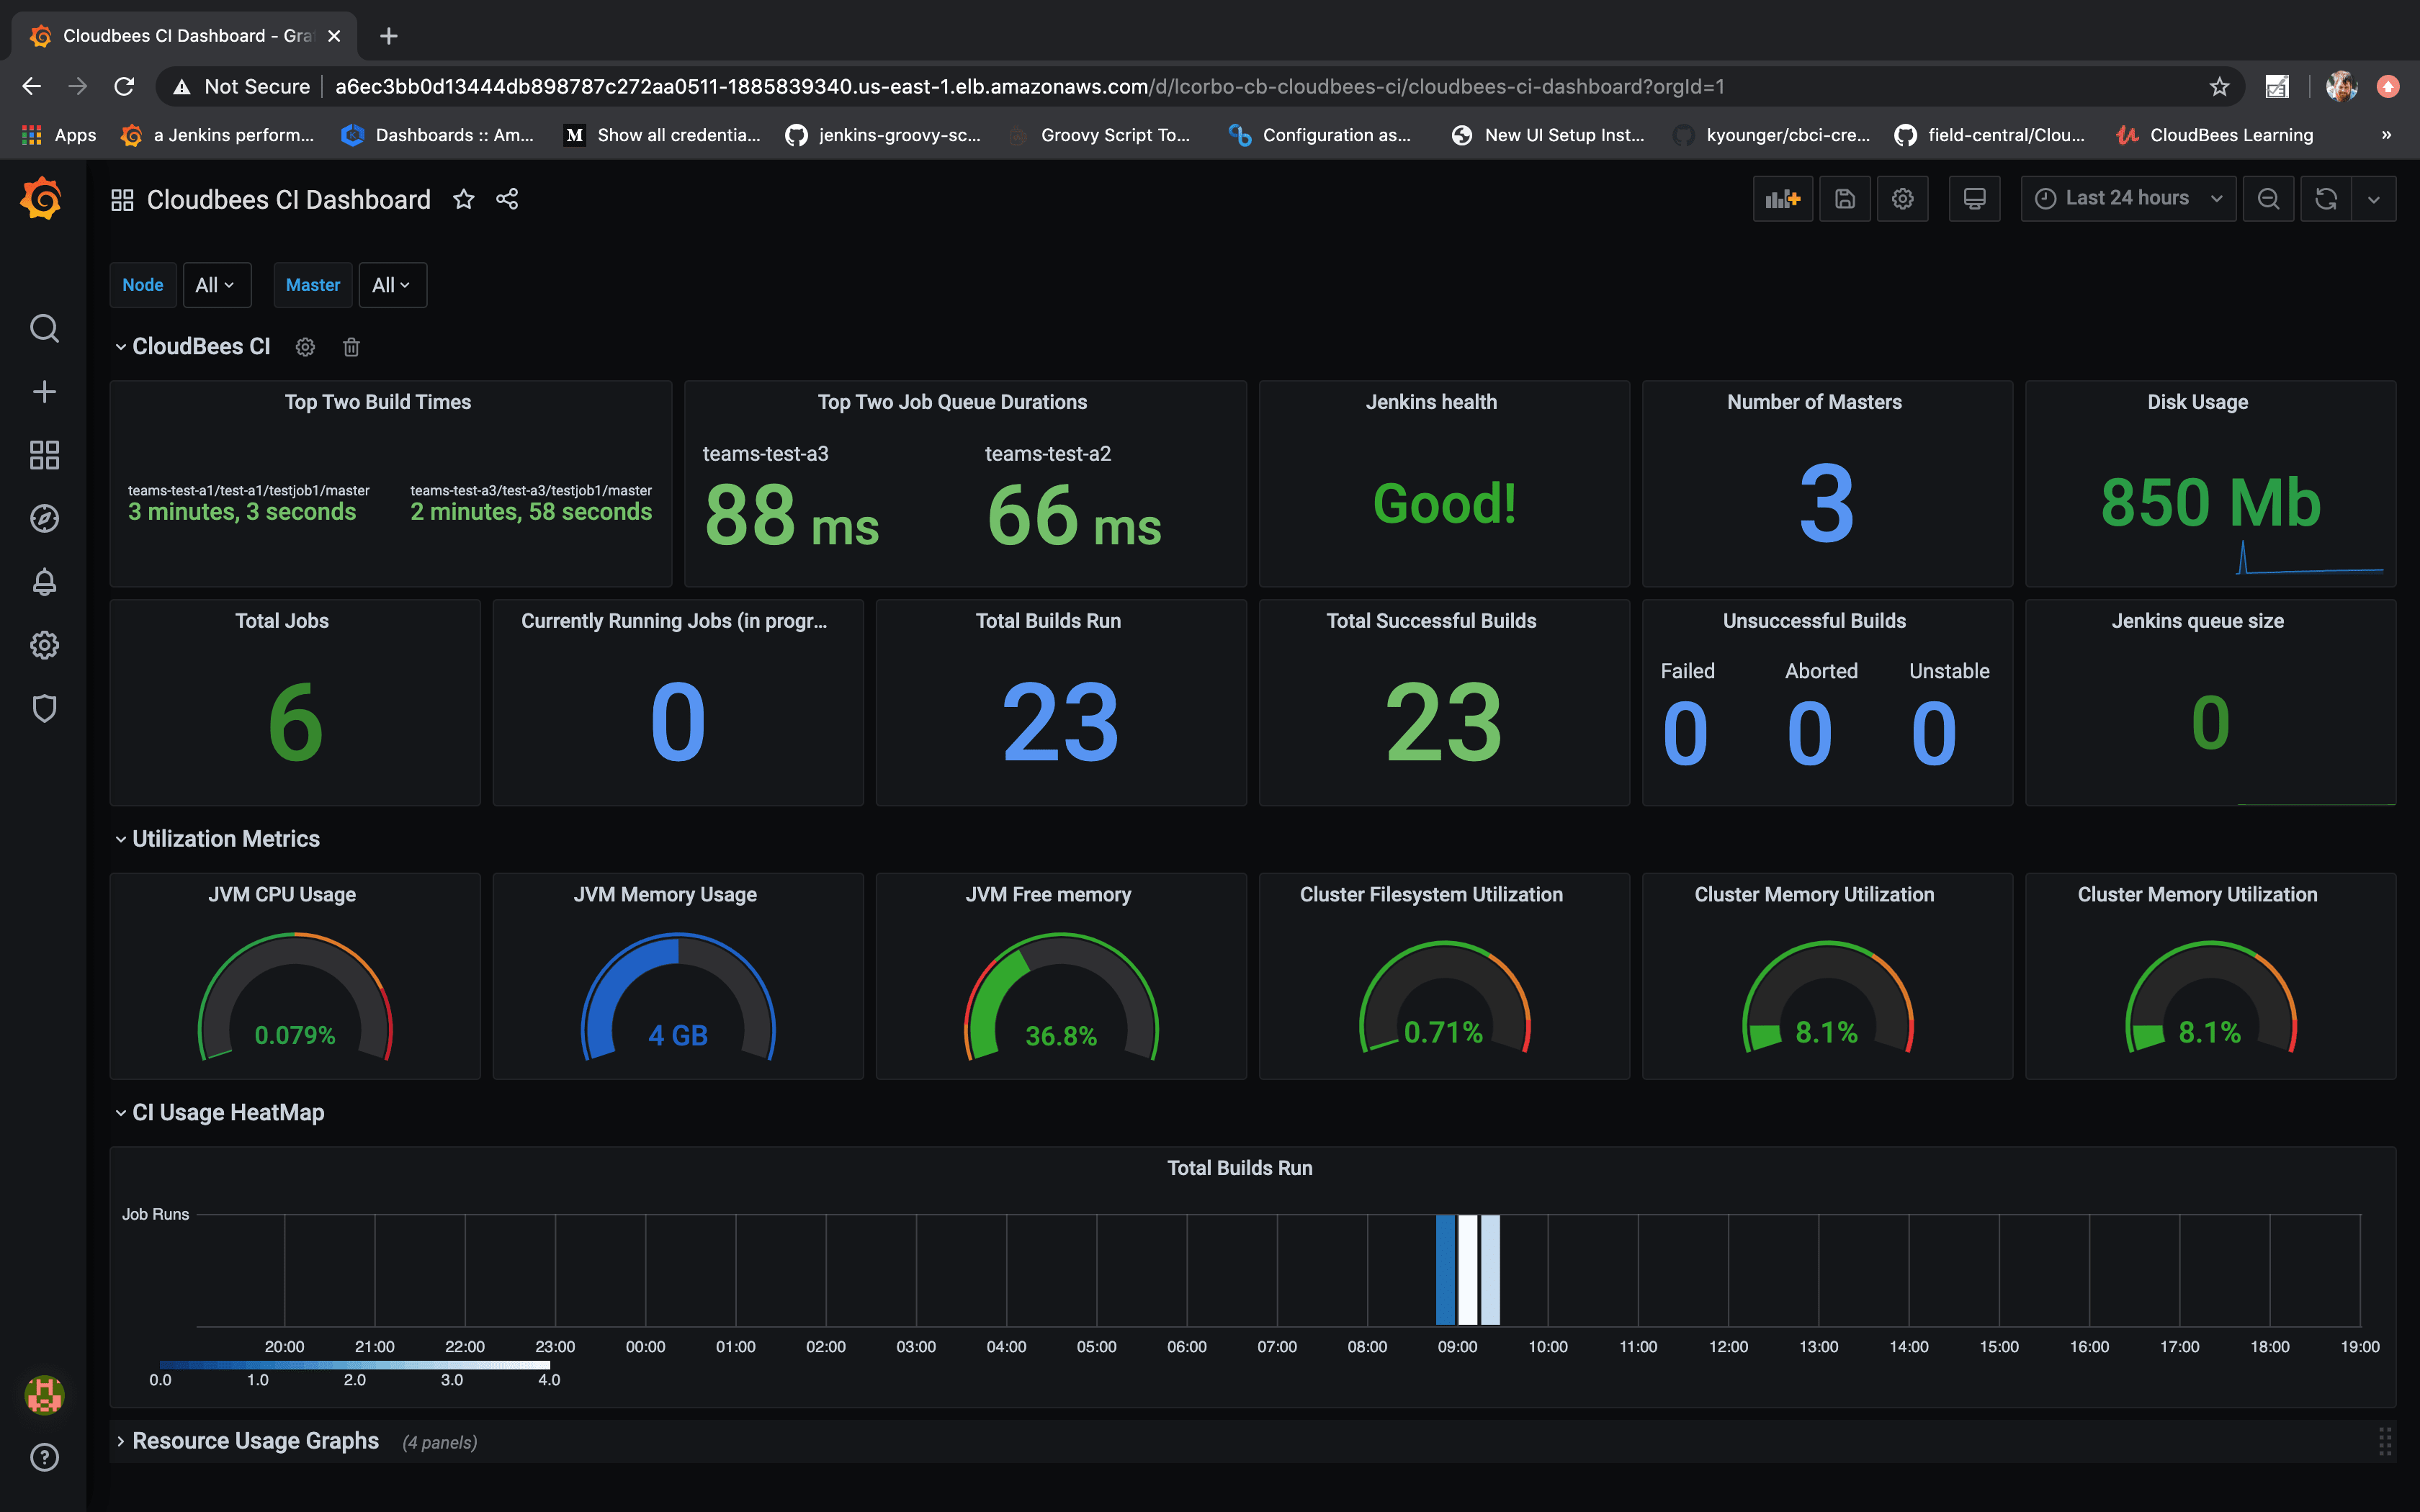
The Cloudbees CI Dashboard dashboard uses the prometheus data source to create a Grafana dashboard with the gauge, graph, heatmap, singlestat and stat panels.
Data source config
Collector type:
Collector plugins:
Collector config:
Revisions
Upload an updated version of an exported dashboard.json file from Grafana
| Revision | Description | Created | |
|---|---|---|---|
| Download |