Traefik 2.2
Traefik dashboard (data from prometheus on k8s) (based on Traefik by Thomas Cheronneau https://grafana.com/grafana/dashboards/4475)
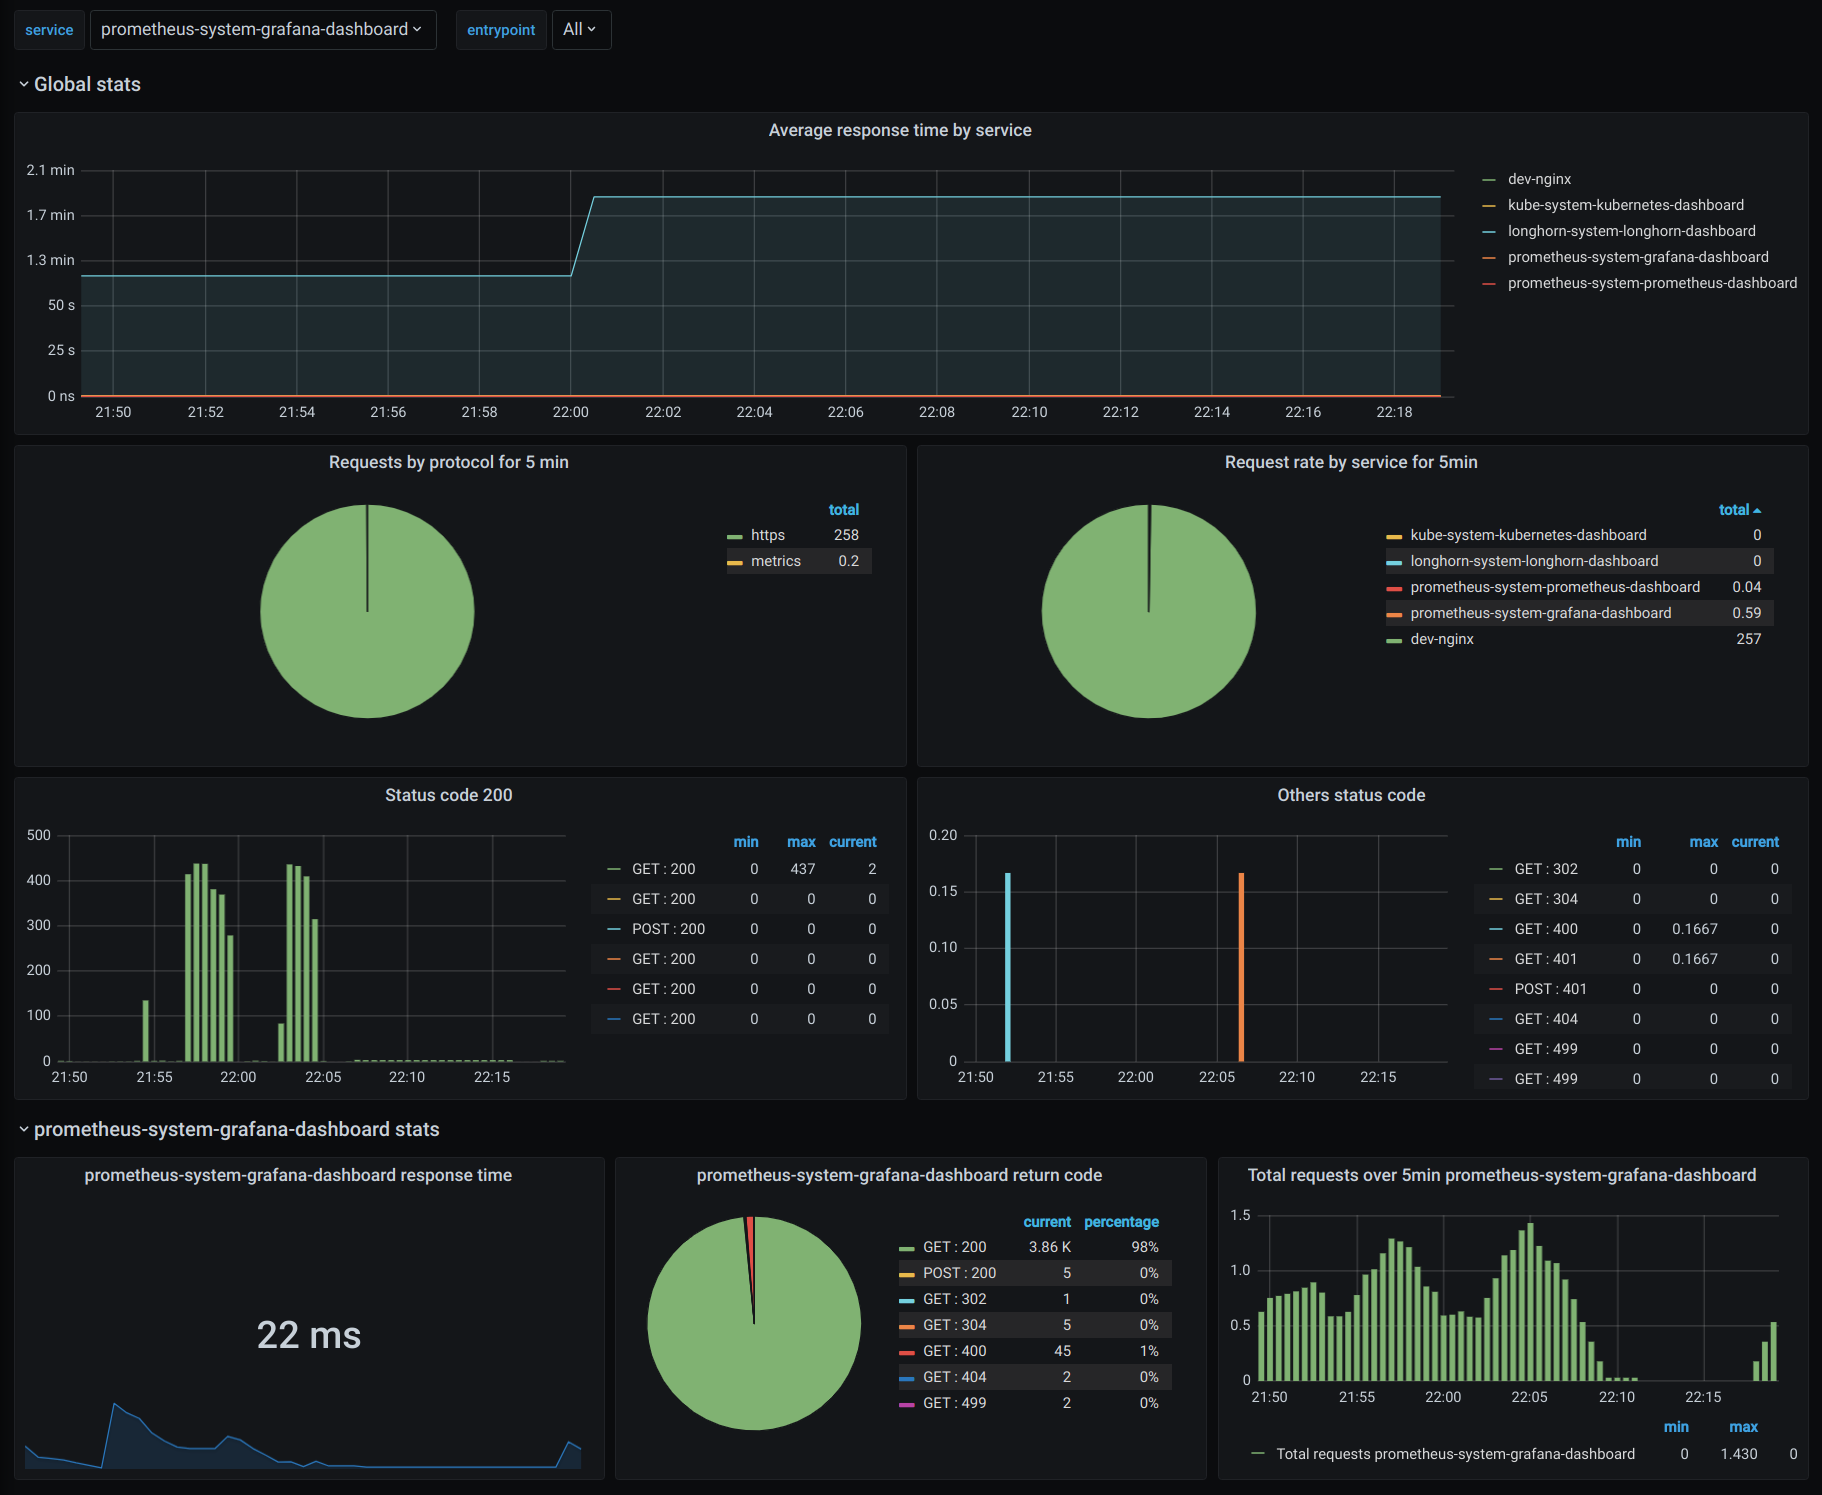
This dashboard presents both global and service stats (variable) for Traefik 2.2 running on k8s with a prometheus datastore.
Data source config
Collector type:
Collector plugins:
Collector config:
Revisions
Upload an updated version of an exported dashboard.json file from Grafana
| Revision | Description | Created | |
|---|---|---|---|
| Download |
Traefik
Easily monitor Traefik, the dynamic load balancer, with Grafana Cloud's out-of-the-box monitoring solution.
Learn more