Teku Monitor
Dashboard Teku Beacon Chain Nodes
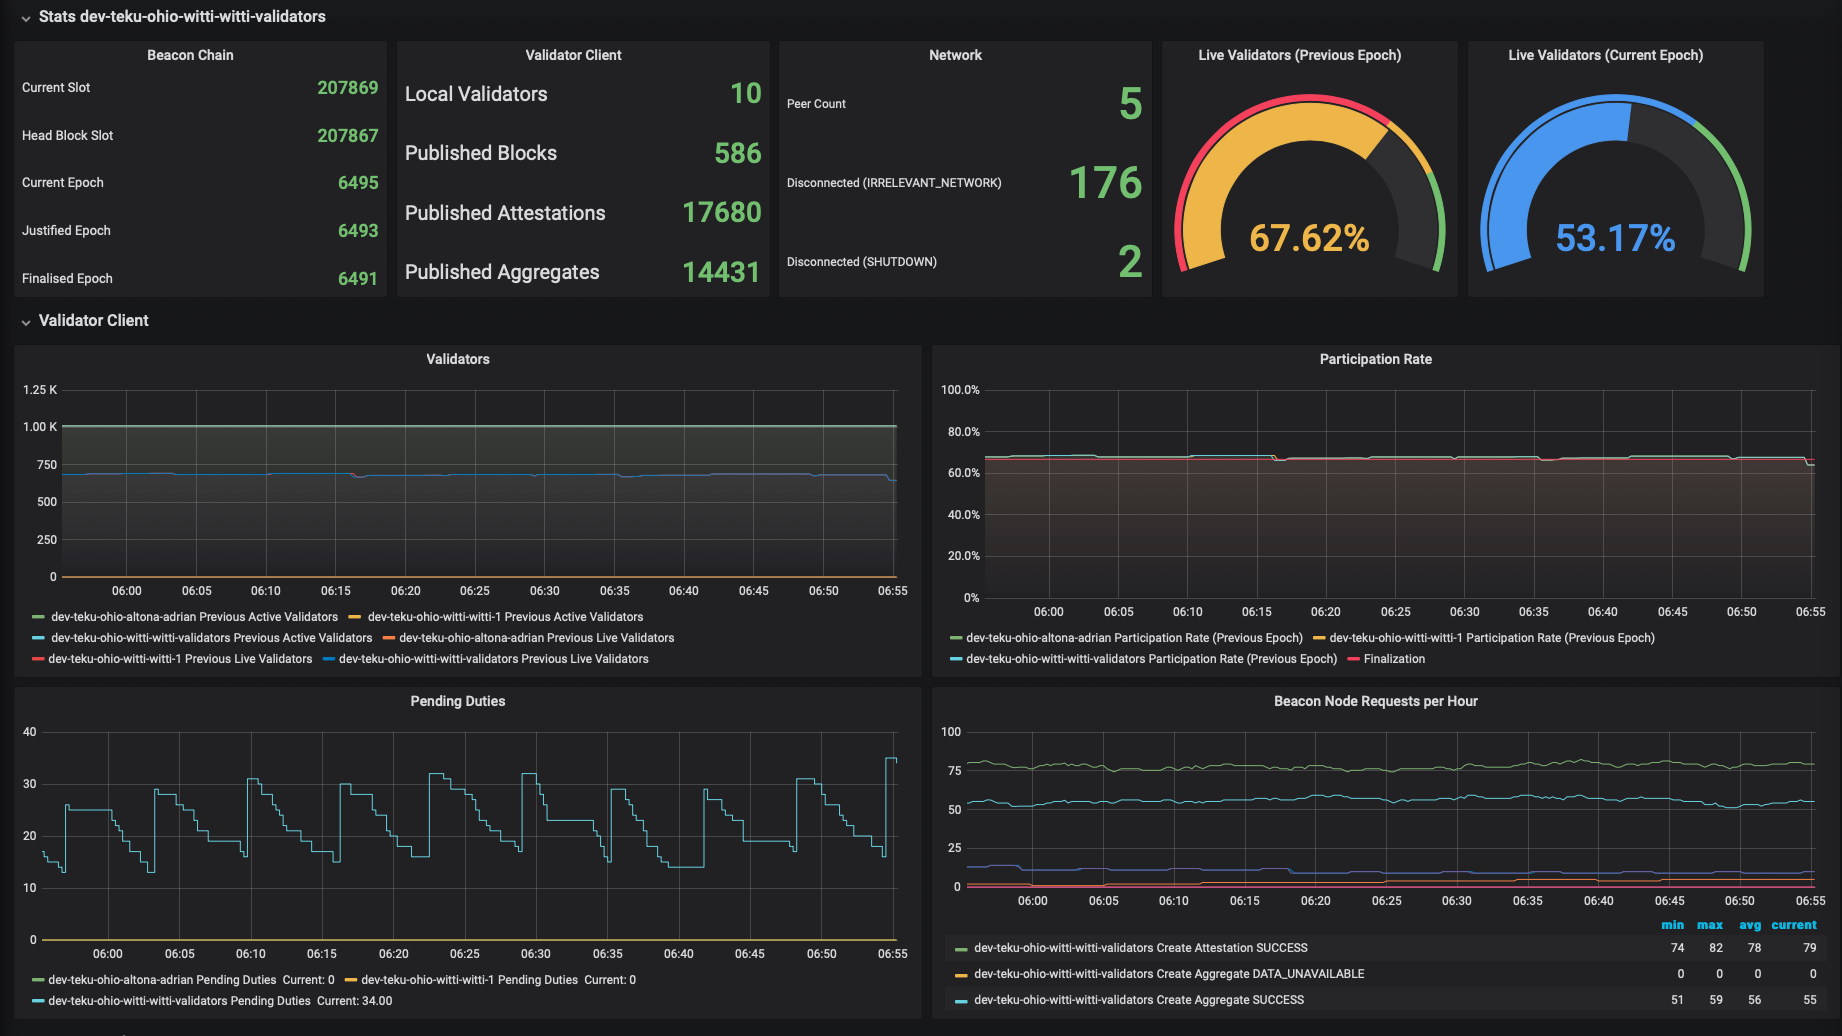
Provides a dashboard for monitoring a Teku Ethereum 2 node. The required data is exported directly from Teku to a Prometheus data store. See the documentation on how to configure Teku and Prometheus.
The dashboard provides information on how well connected Teku is to the network, current, justified and finalized slot and epoch information, along with CPU and memory usage statistics.
Data source config
Collector type:
Collector plugins:
Collector config:
Revisions
Upload an updated version of an exported dashboard.json file from Grafana
| Revision | Description | Created | |
|---|---|---|---|
| Download |