Smokeping (generic)
Display SmokePing measurements
This is a dashboard that can help you visualize Smokeping measurements (via Smokeping - Influxdb intergration). You can use this Smokeping fork (https://github.com/mad-ady/SmokePing), or in docker form (https://github.com/mad-ady/docker-smokeping) to write measurement data to both rrd and InfluxDB, with some added tags (https://github.com/mad-ady/SmokePing/commit/2b03c1c16733268f2f47beed6dd9b67d4a5ae30c, https://github.com/oetiker/SmokePing/issues/201#issuecomment-606169056). Most of these changes will make it back into the master Smokeping branch, so you can try that as well.
More information here: https://adrianpopagh.blogspot.com/2020/06/smokeping-influxdb-export-docker-slaves.html
Once smokeping exports data to influxdb you can graph it in Grafana with this dashboard. There are some variables to help you filter out what you want to see. The most important ones are:
- measurement_type -> will get filled with the Smokeping probe name
- slave -> will be the slave name (or 'master' for measurements made on the master system)
- host -> will be the value for the host parameter in your measurement
- all other variables are custom (defined for my use). Feel free to change the queries to add/remove them
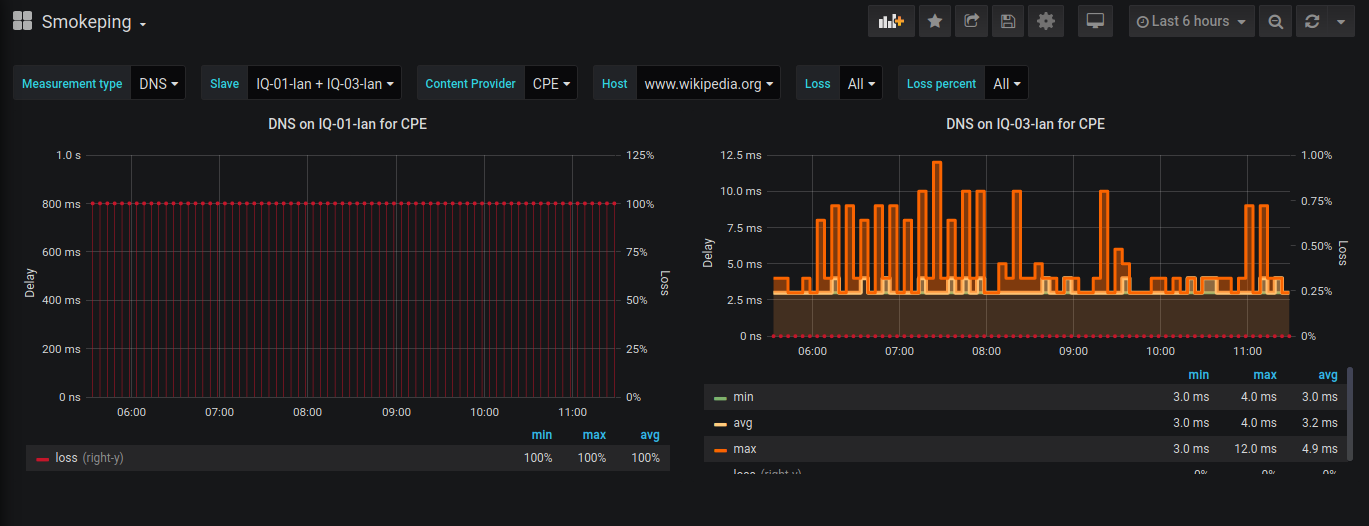
The screenshot shows measurements for the DNS probe for two slaves, measurement done asking the CPE for host www.wikipedia.org
Data source config
Collector config:
Upload an updated version of an exported dashboard.json file from Grafana
| Revision | Description | Created | |
|---|---|---|---|
| Download |
