Choria Server Provisioner
Dashboard for the Choria Server Provisioner
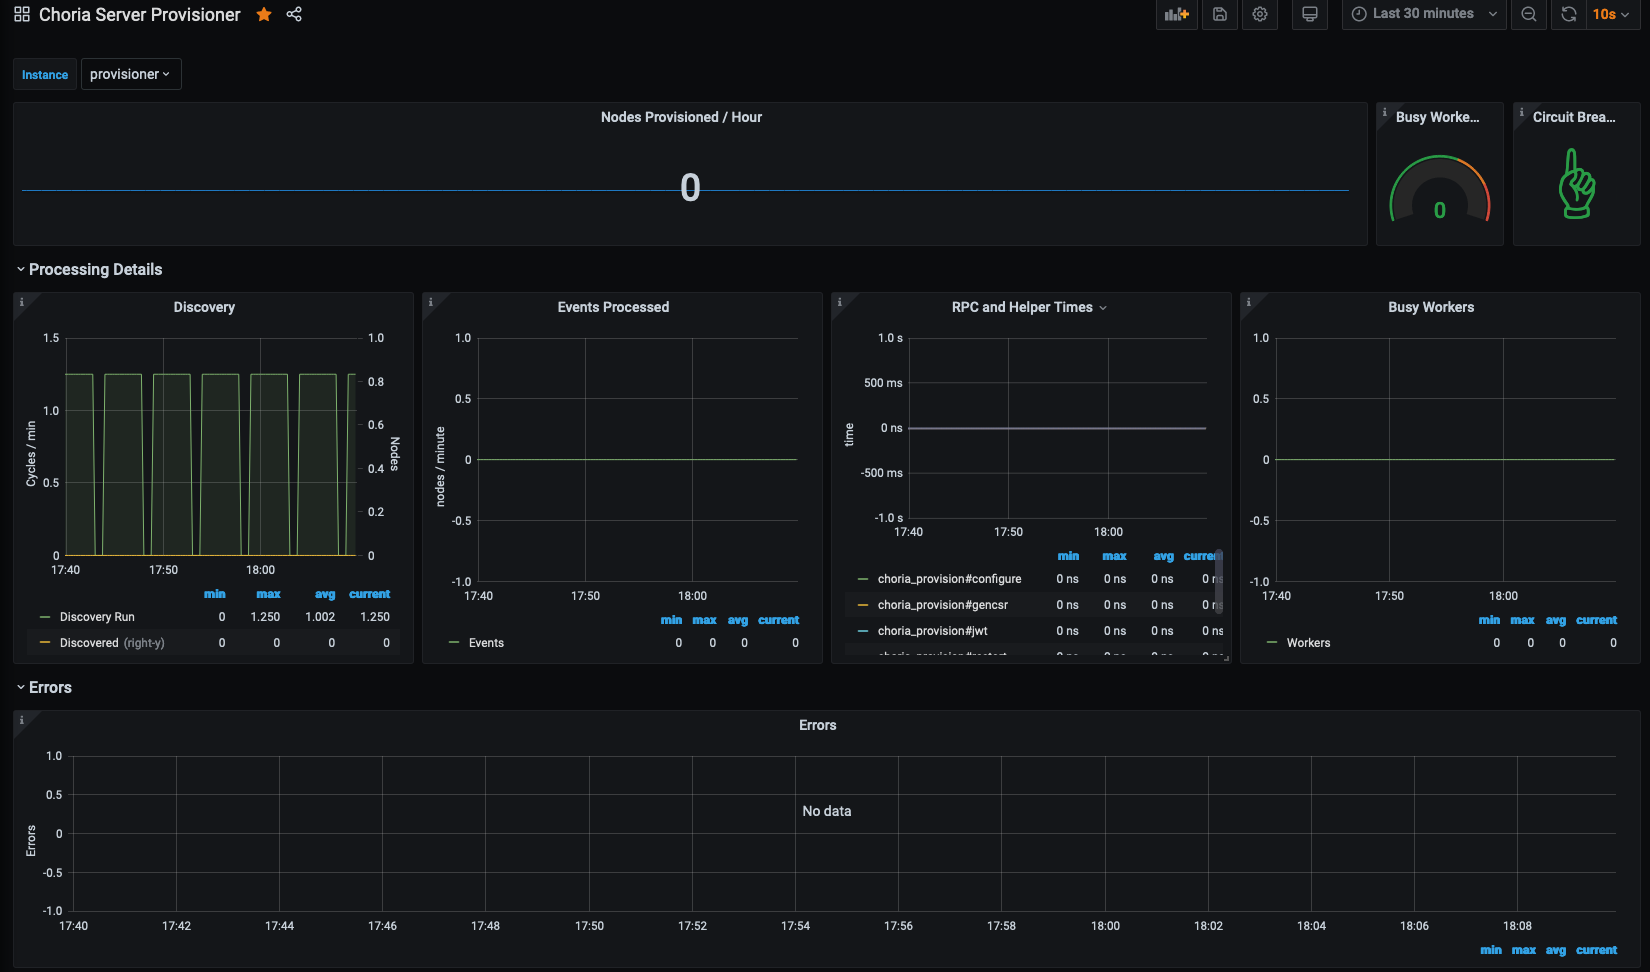
Shows detail about the node provisioning process produced by Provisioning Agent when monitor_port is set to a value greater than 0. Metrics are exposed on /metrics
Data source config
Collector type:
Collector plugins:
Collector config:
Revisions
Upload an updated version of an exported dashboard.json file from Grafana
| Revision | Description | Created | |
|---|---|---|---|
| Download |