C-lightning node
C-lightning routing node monitor. C-lightning is a Bitcoin Lightning Network client.
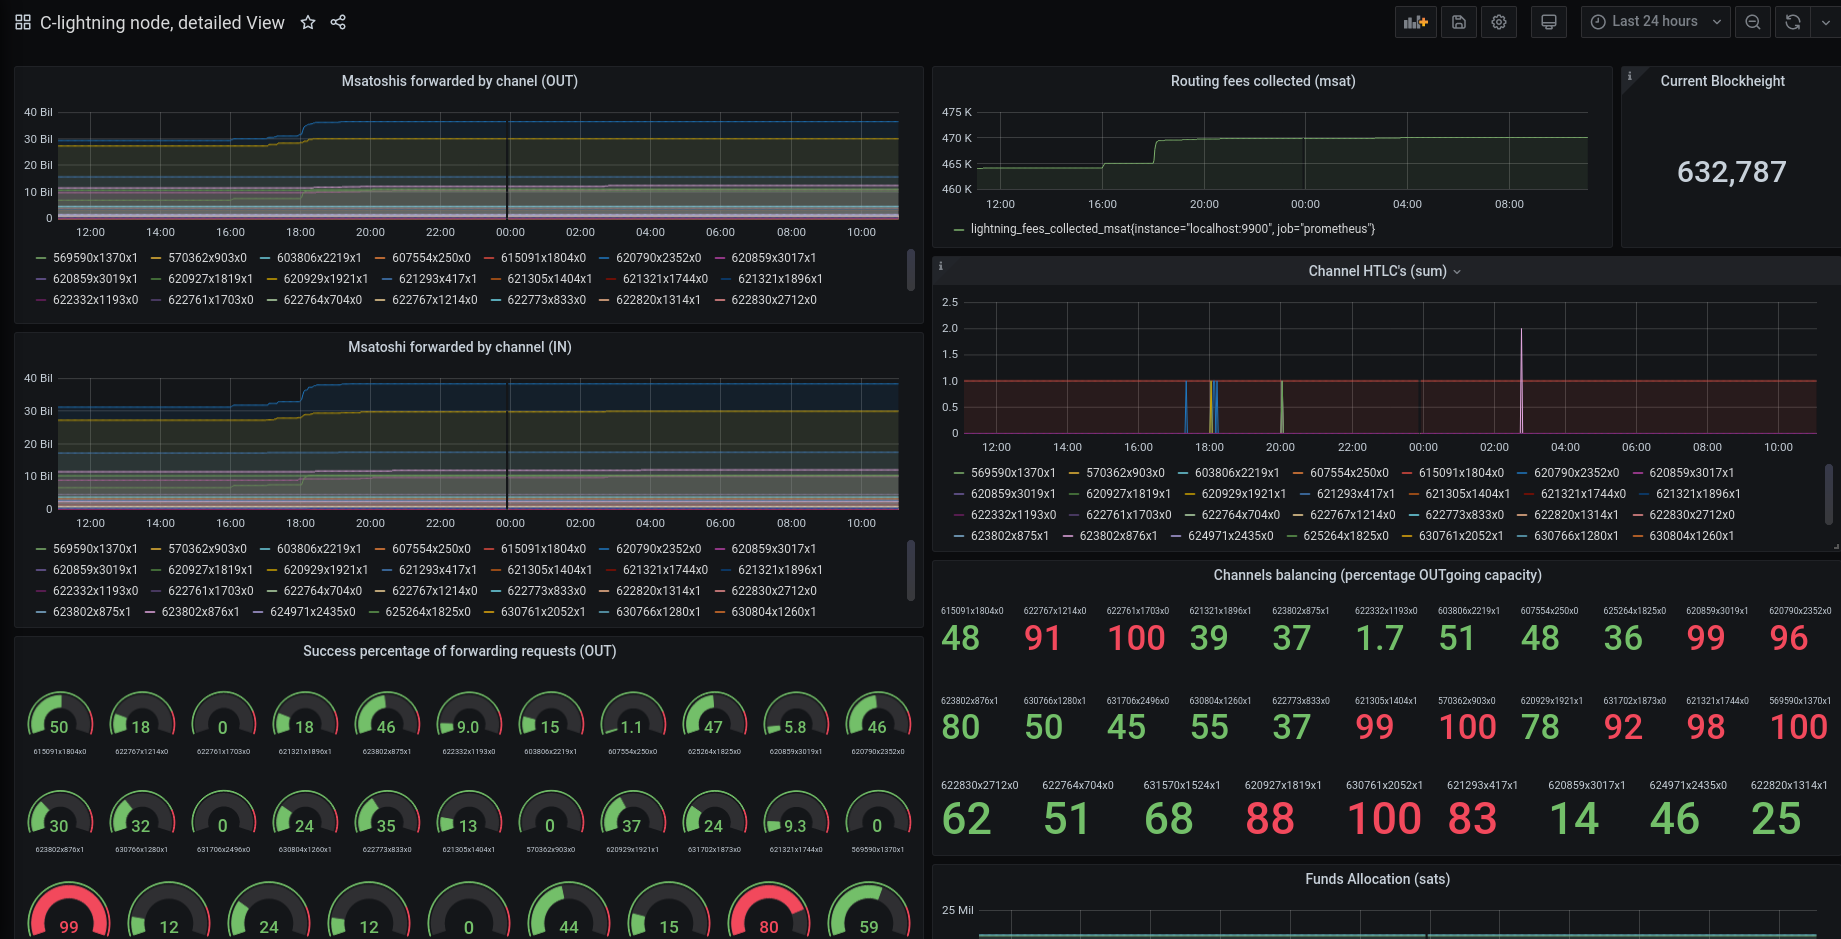
A frontend for the Prometheus C-lightning plugin datas.
The emphasis is put on routing :
- Forwarding success rate of channels IN / OUT
- Msats collected
- Msats forwarded
Still, some general-purpose informations are showcased too :
- Number of HTLCs currently locked by channel
- Funds allocation
- Channel balancing (percentage)
This dashboard was modified from Lisa Neigut's (@niftynei) one and I kept the HTLCs, funds allocation and blockheight panel from it.
Data source config
Collector type:
Collector plugins:
Collector config:
Revisions
Upload an updated version of an exported dashboard.json file from Grafana
| Revision | Description | Created | |
|---|---|---|---|
| Download |
Linux Server
Monitor Linux with Grafana. Easily monitor your Linux deployment with Grafana Cloud's out-of-the-box monitoring solution.
Learn more